Why is my Mac slow? How to find the cause
A slow Mac usually comes down to one of four things: an app keeping the processor busy, too little memory for what’s open, a startup disk that’s nearly full, or heat. Activity Monitor and Storage settings, both built into macOS, show which one it is. Each has a fix you can make yourself.
Is one app keeping the processor busy?
An app that’s exporting, rendering, syncing or stuck can take most of the processor, and everything else waits.
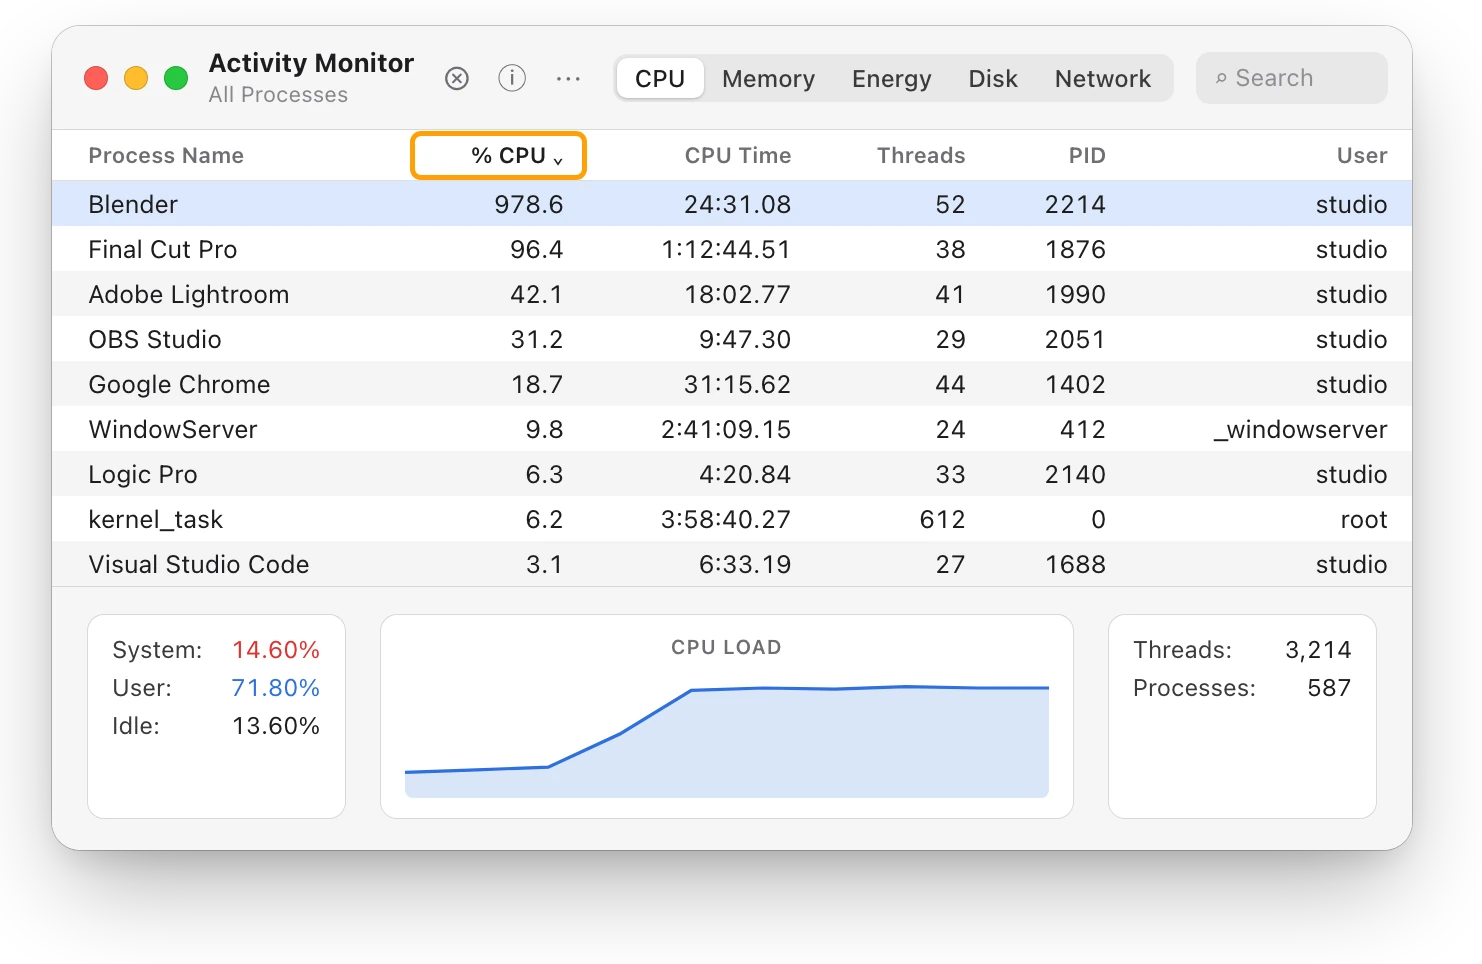
- Open Activity Monitor. It’s in Applications > Utilities, or search for it with Spotlight.
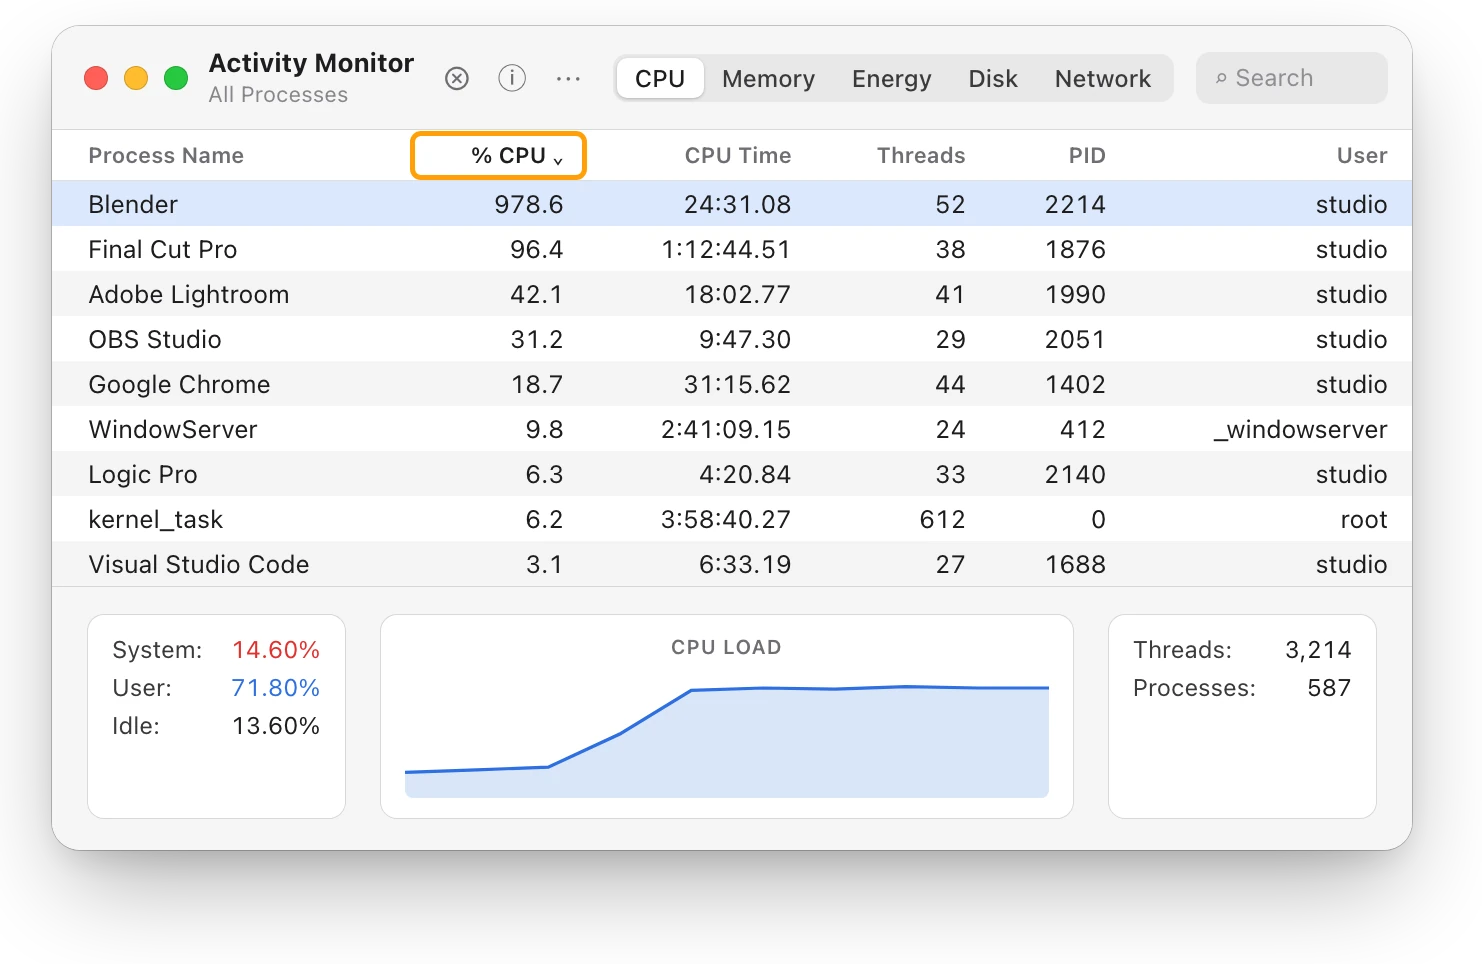
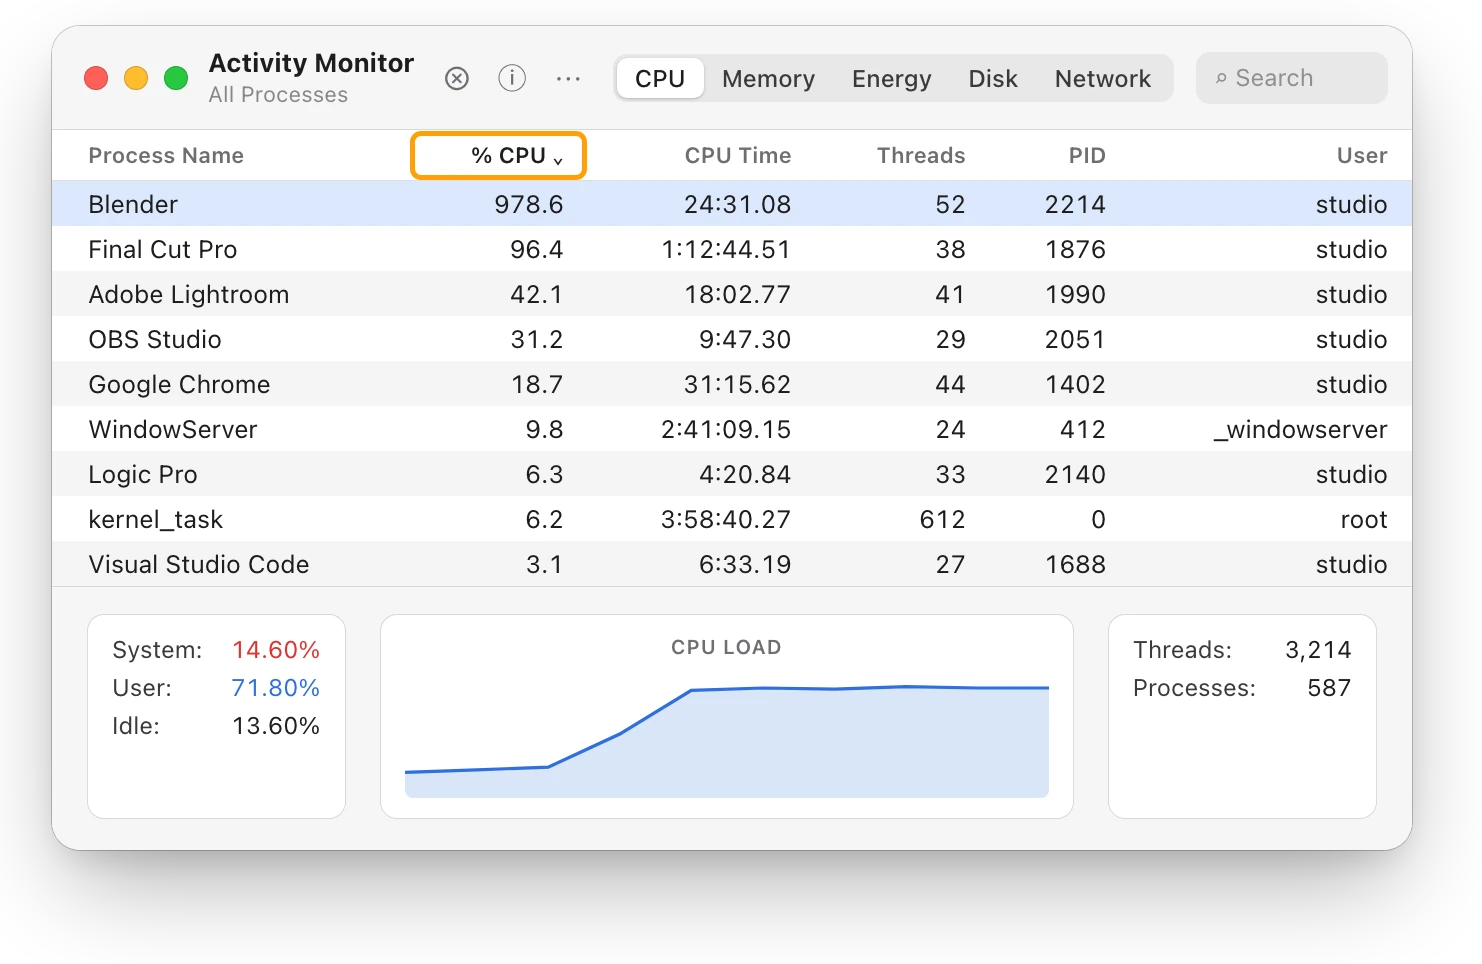
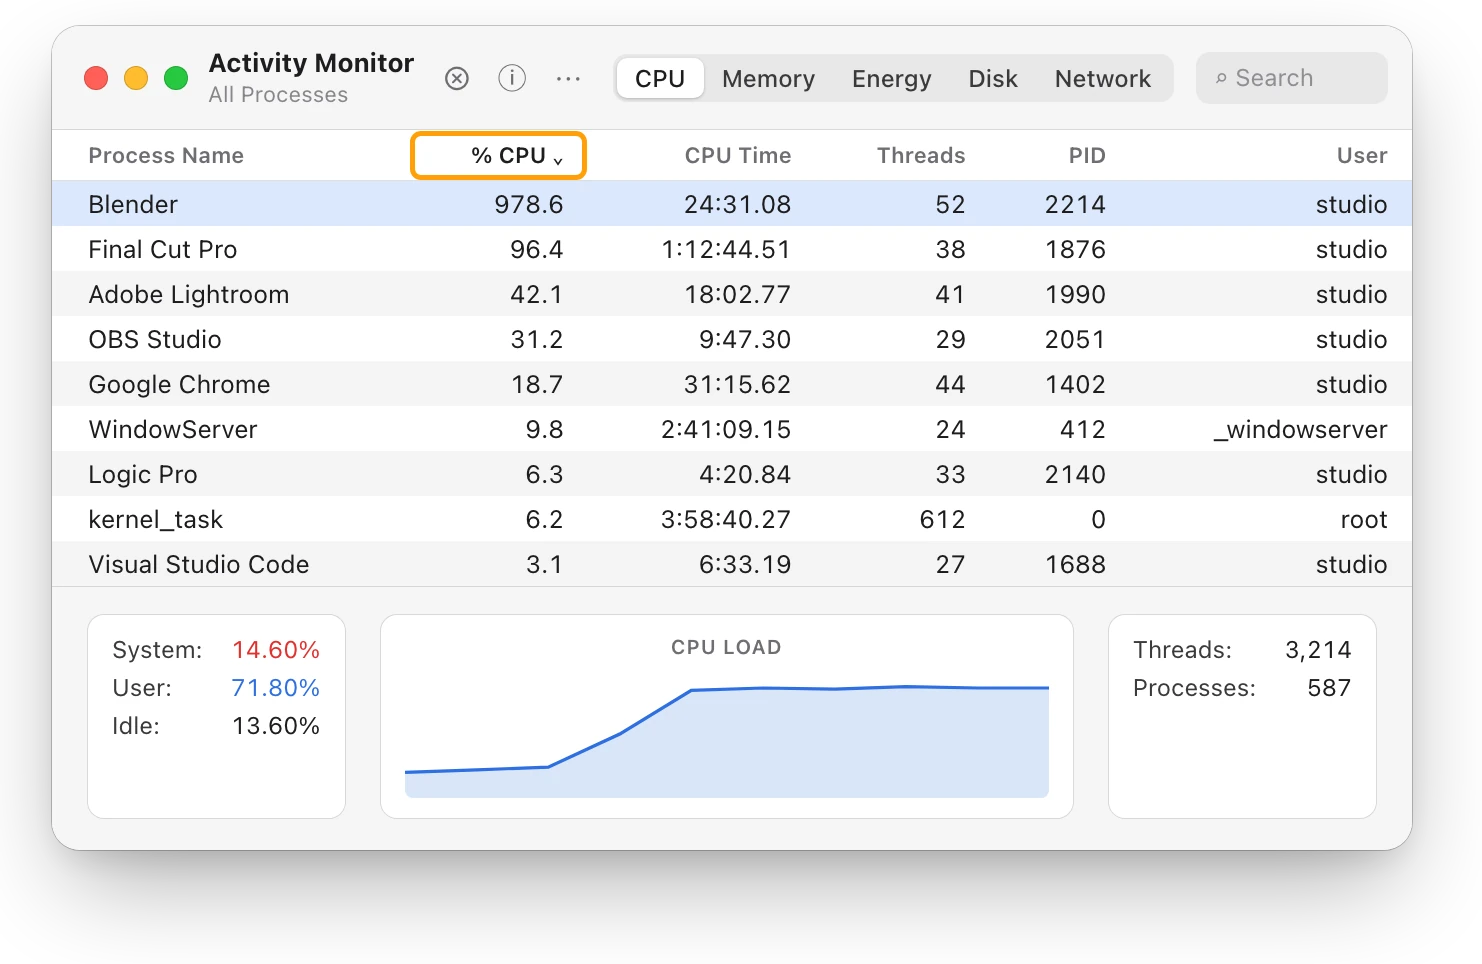
- Click CPU. Then click the % CPU column heading to sort the list, busiest first.
- Look at the top of the list. Short spikes while apps open are normal. An app that stays at the top for minutes is the one slowing things down.
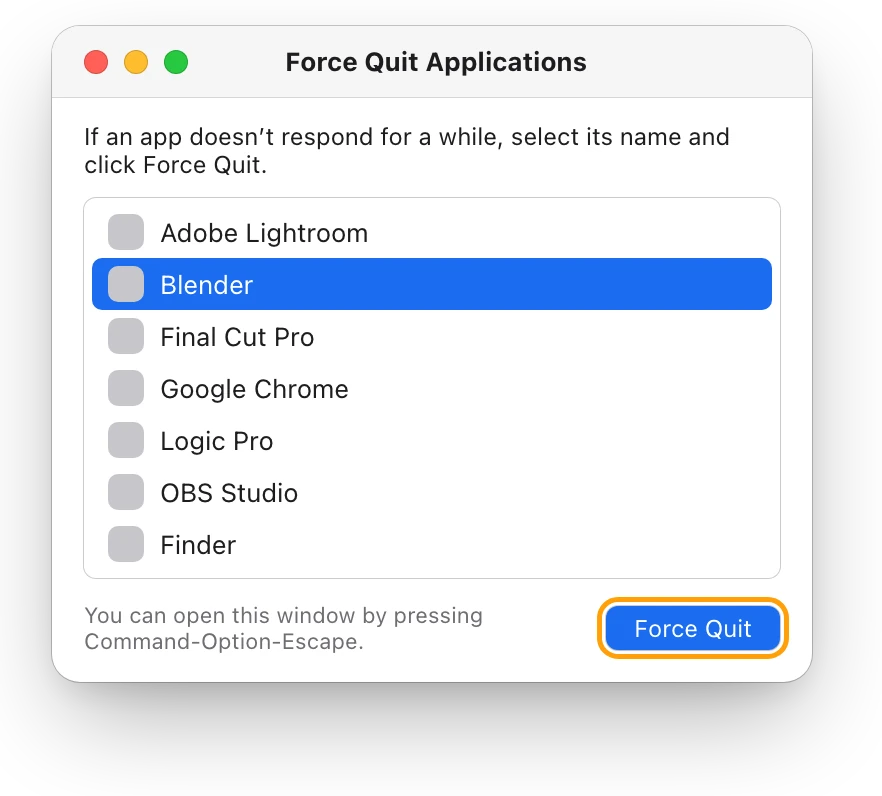
- If you don’t need that app right now, quit it. Select it, click the Stop button at the top of the window, then choose Quit. Use Force Quit only for an app that isn’t responding, because unsaved work in it is lost.
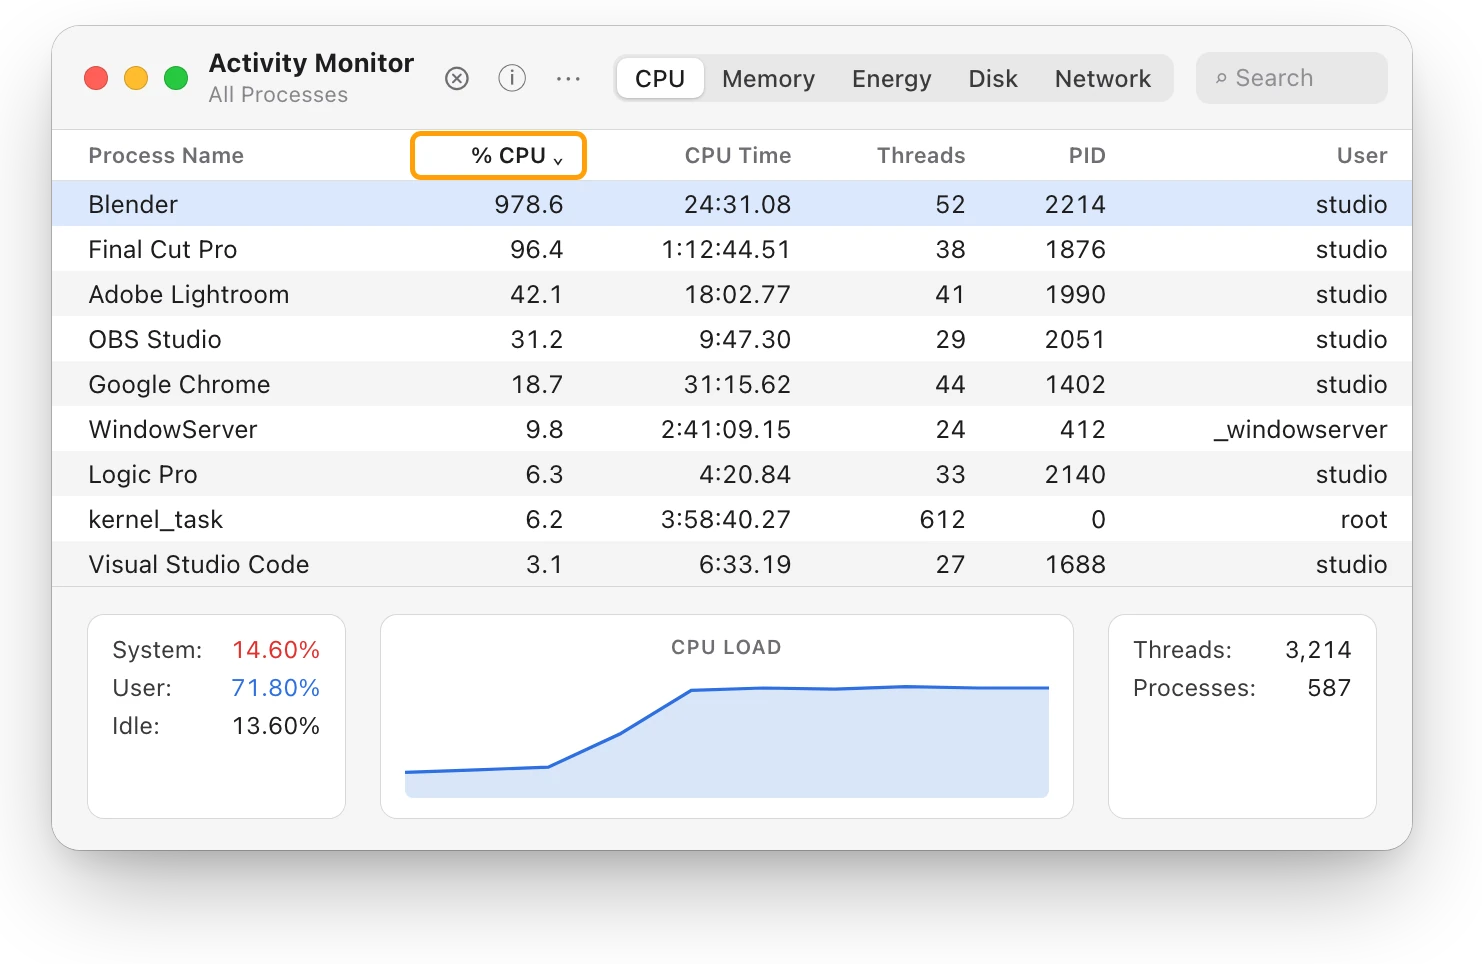
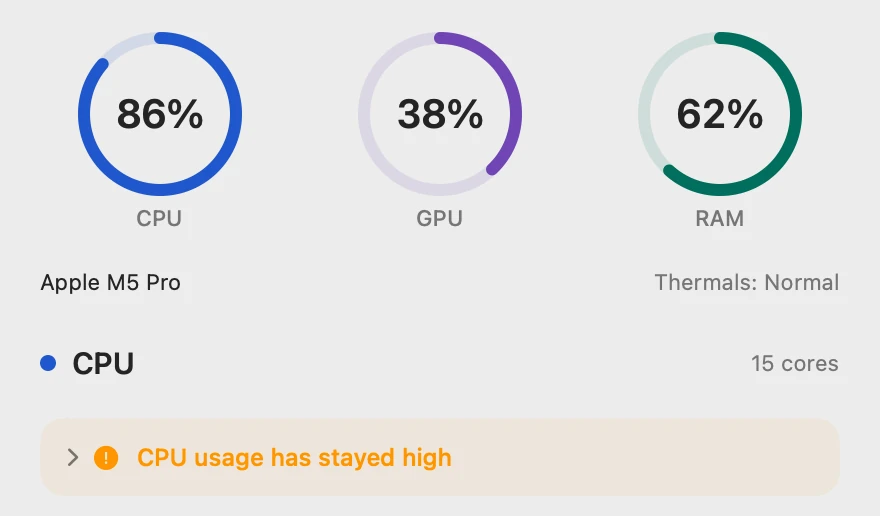
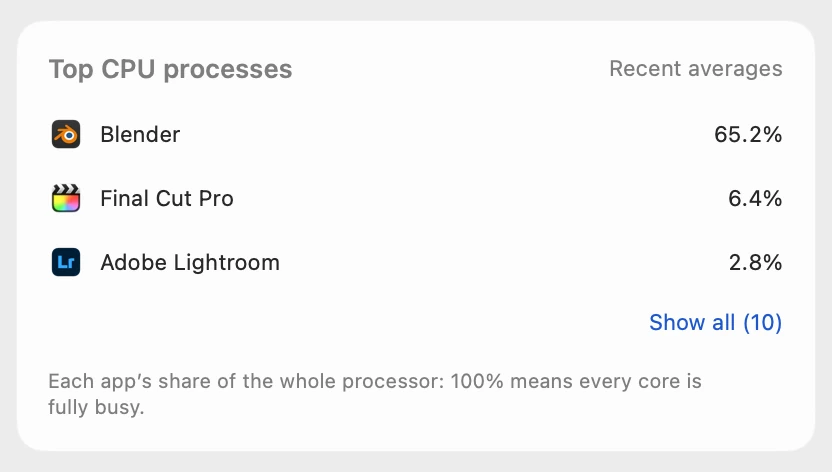
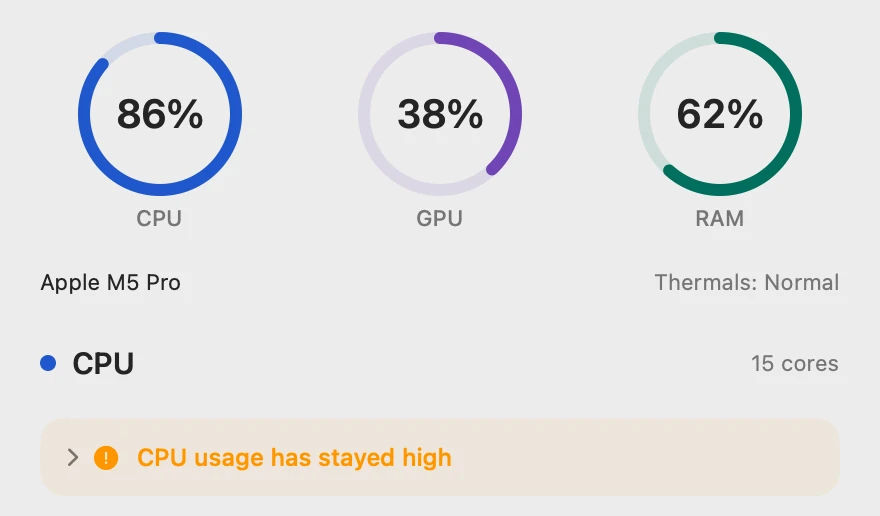
Activity Monitor counts each processor core as 100%, so an app working on several cores can show more than 100%. This Mac has 15 cores, so Blender’s 978.6% means it’s keeping about 10 of them busy.
Is your Mac short of memory?
Look at memory pressure, not at how much memory is used. macOS works best when it uses all of its memory, including for files it may need again. Apple says unused memory doesn’t necessarily make a Mac faster.
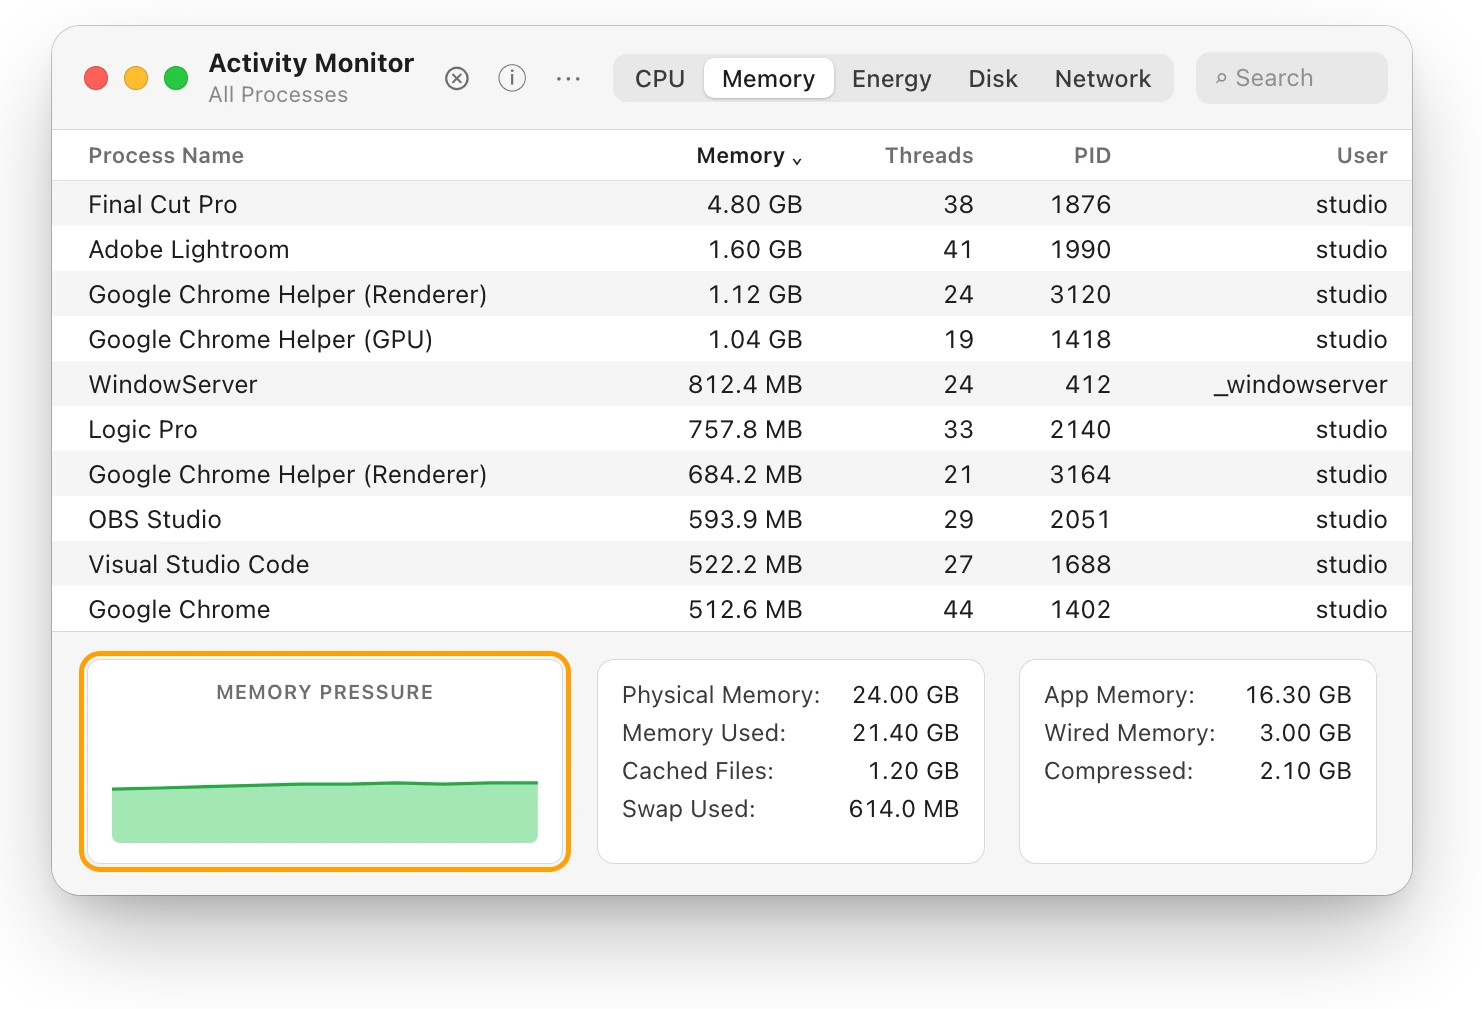
- In Activity Monitor, click Memory.
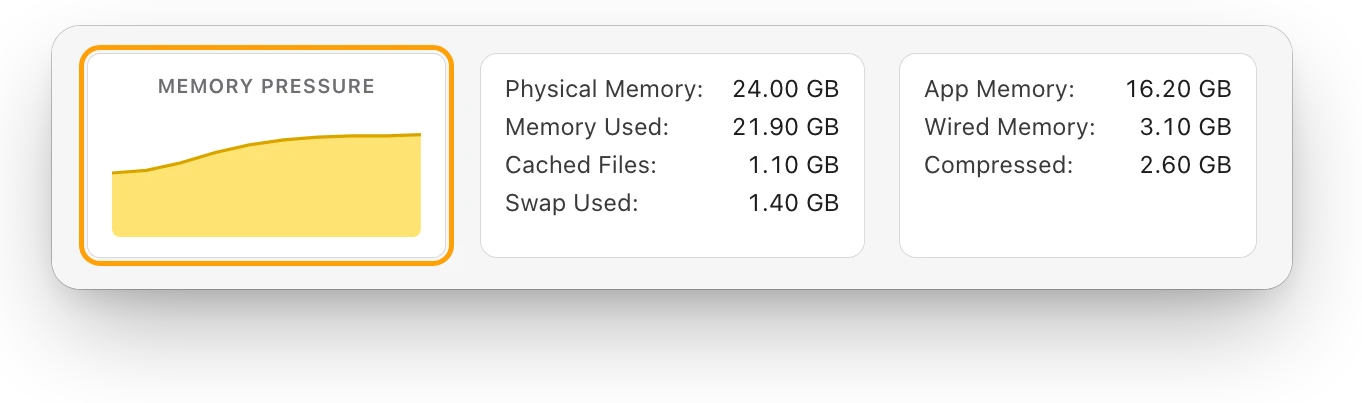
- Read the Memory Pressure graph at the bottom of the window:
- Green: your Mac is using its memory efficiently.
- Yellow: your Mac might eventually need more memory.
- Red: your Mac needs more memory.
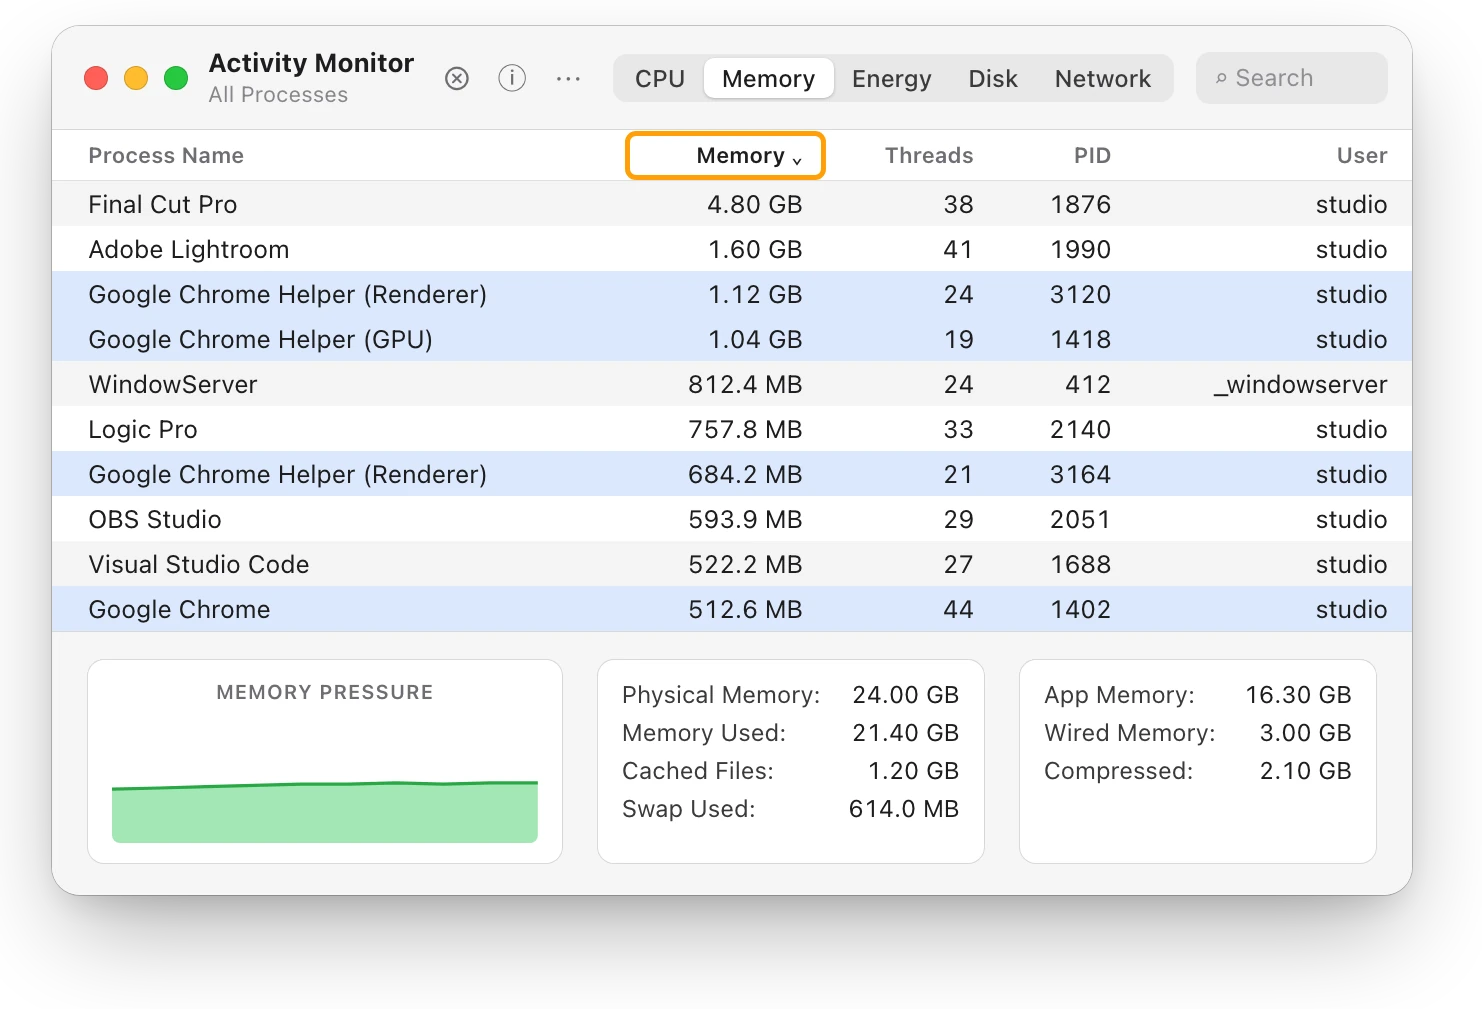
- If it’s yellow or red, click the Memory column heading to see which apps use the most. Save your work, then quit the ones you don’t need. Closing browser tabs you’re done with also helps.
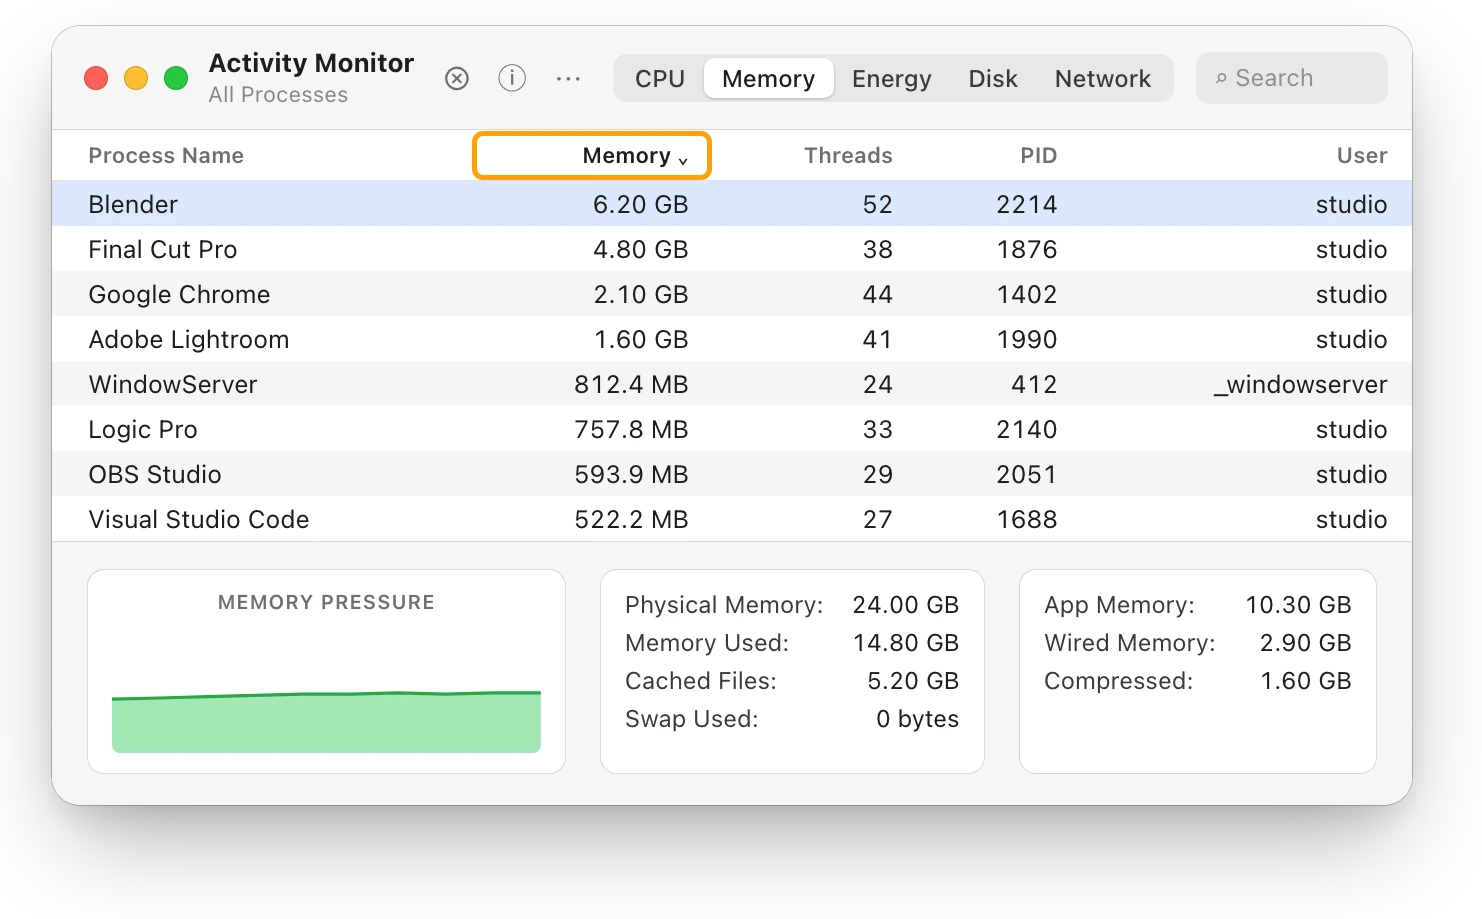
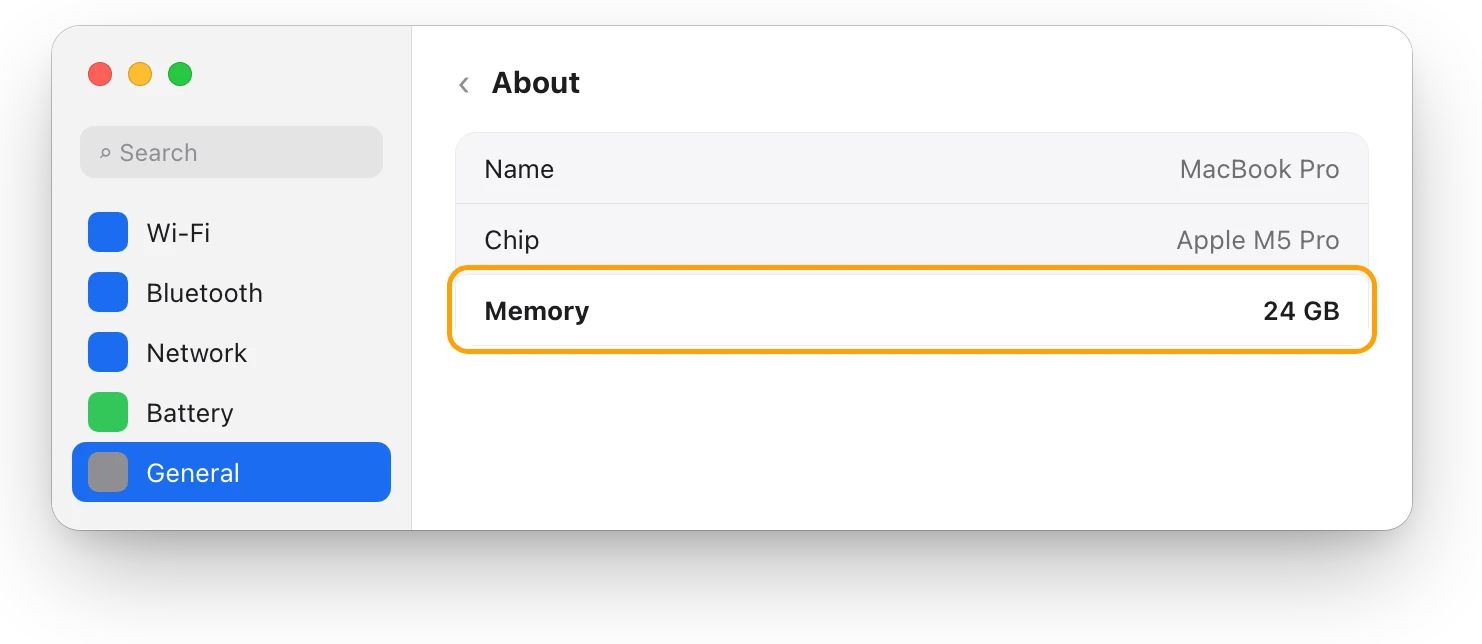
If memory pressure stays yellow or red during your normal work, your Mac may need more memory. To see whether it can take more, hold Option, choose Apple menu > System Information, and click Memory. If you don’t see a Memory Slots section, its memory can’t be upgraded.
Is your startup disk nearly full?
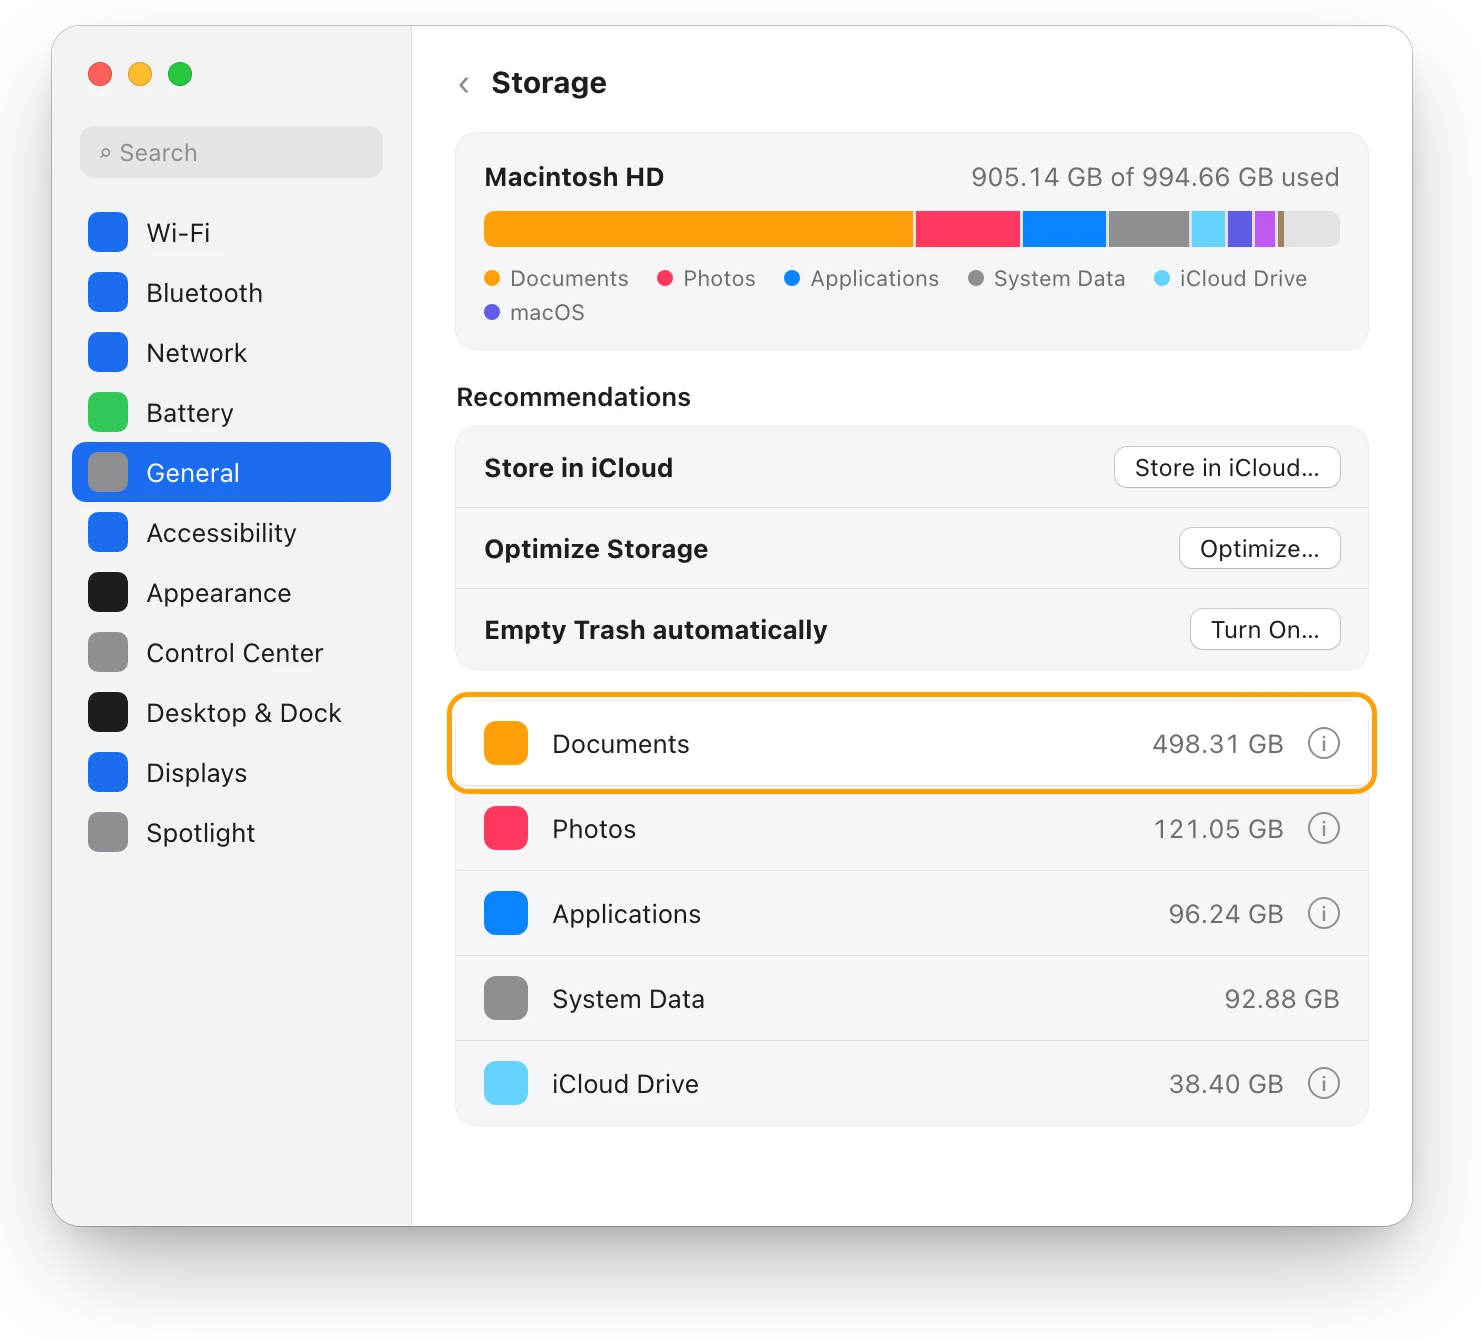
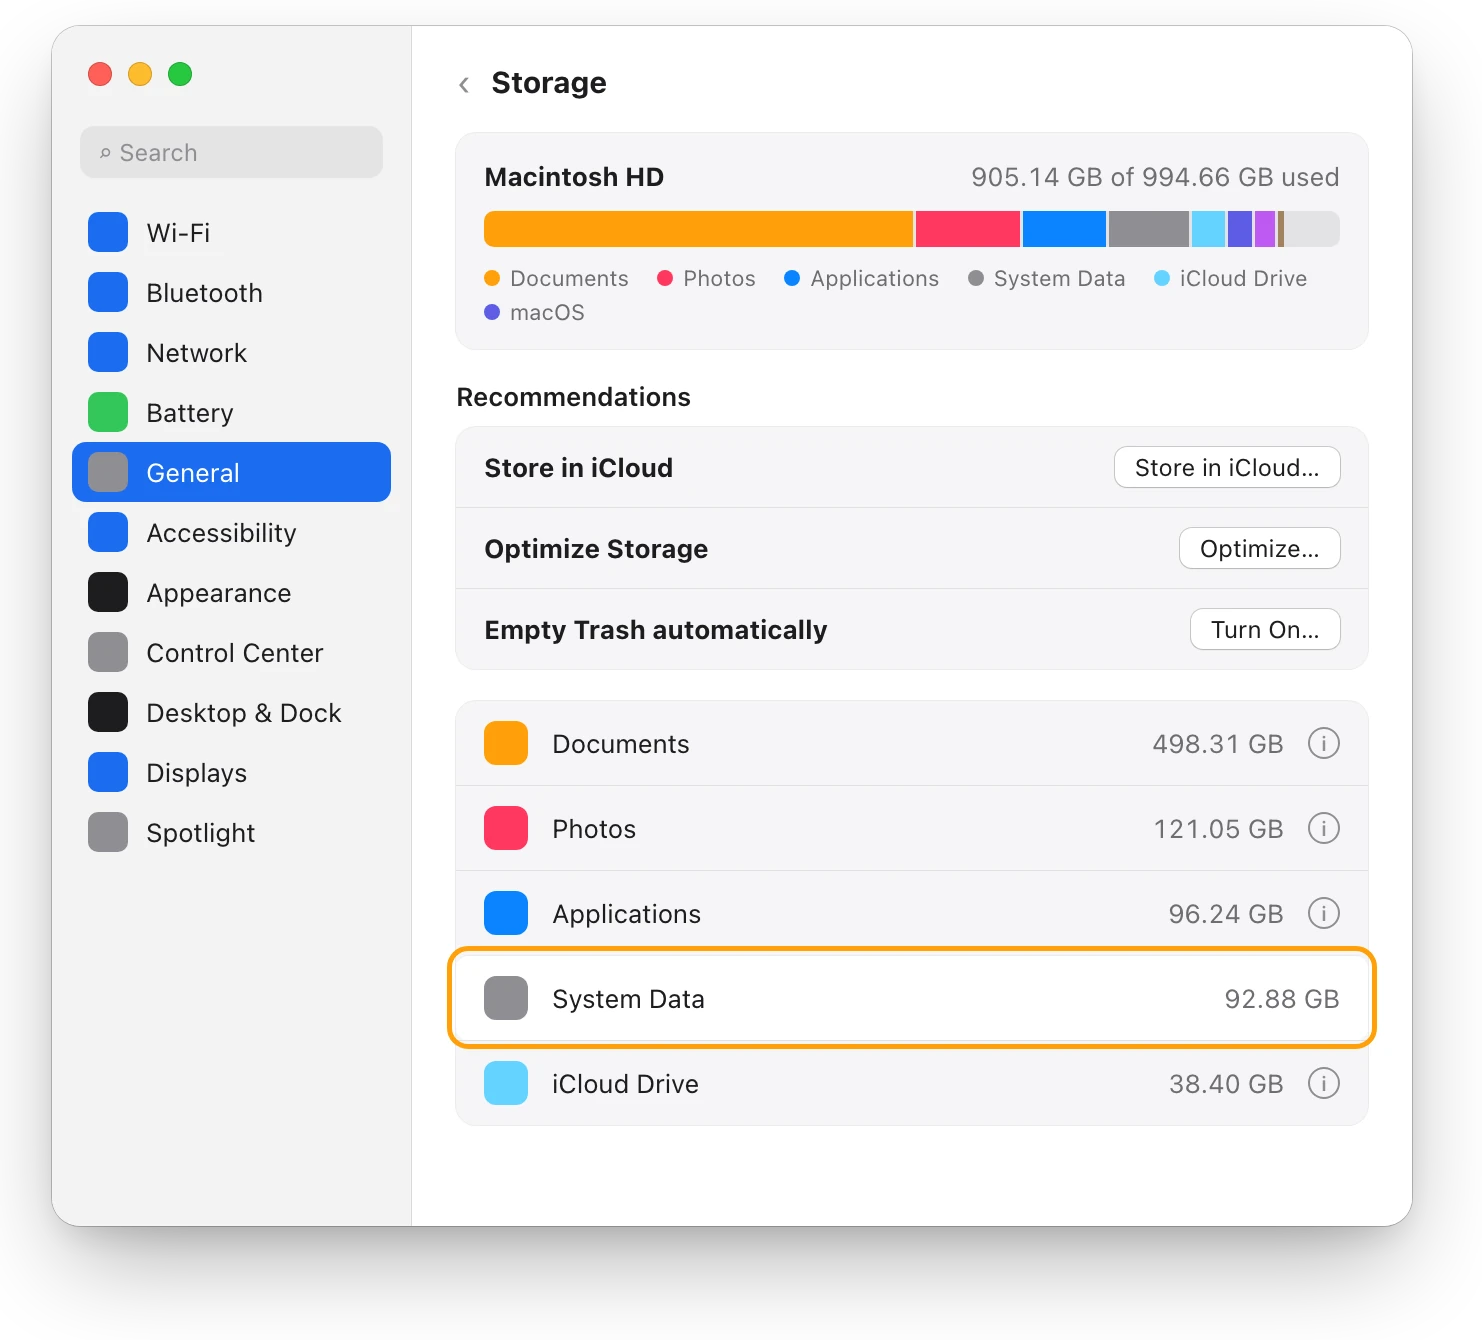
Storage settings shows how full your startup disk is. Apple lists low free space among the things to check when a Mac runs slowly.
- Choose Apple menu > System Settings, click General in the sidebar, then click Storage.
- Try the recommendations at the top: Store in iCloud, Optimize Storage and Empty Trash automatically.
- Click a category below them for more information and options.
- Move large files you want to keep to an external drive, and delete files you no longer need.
- Empty the Trash. Files in the Trash still take up space until you do.
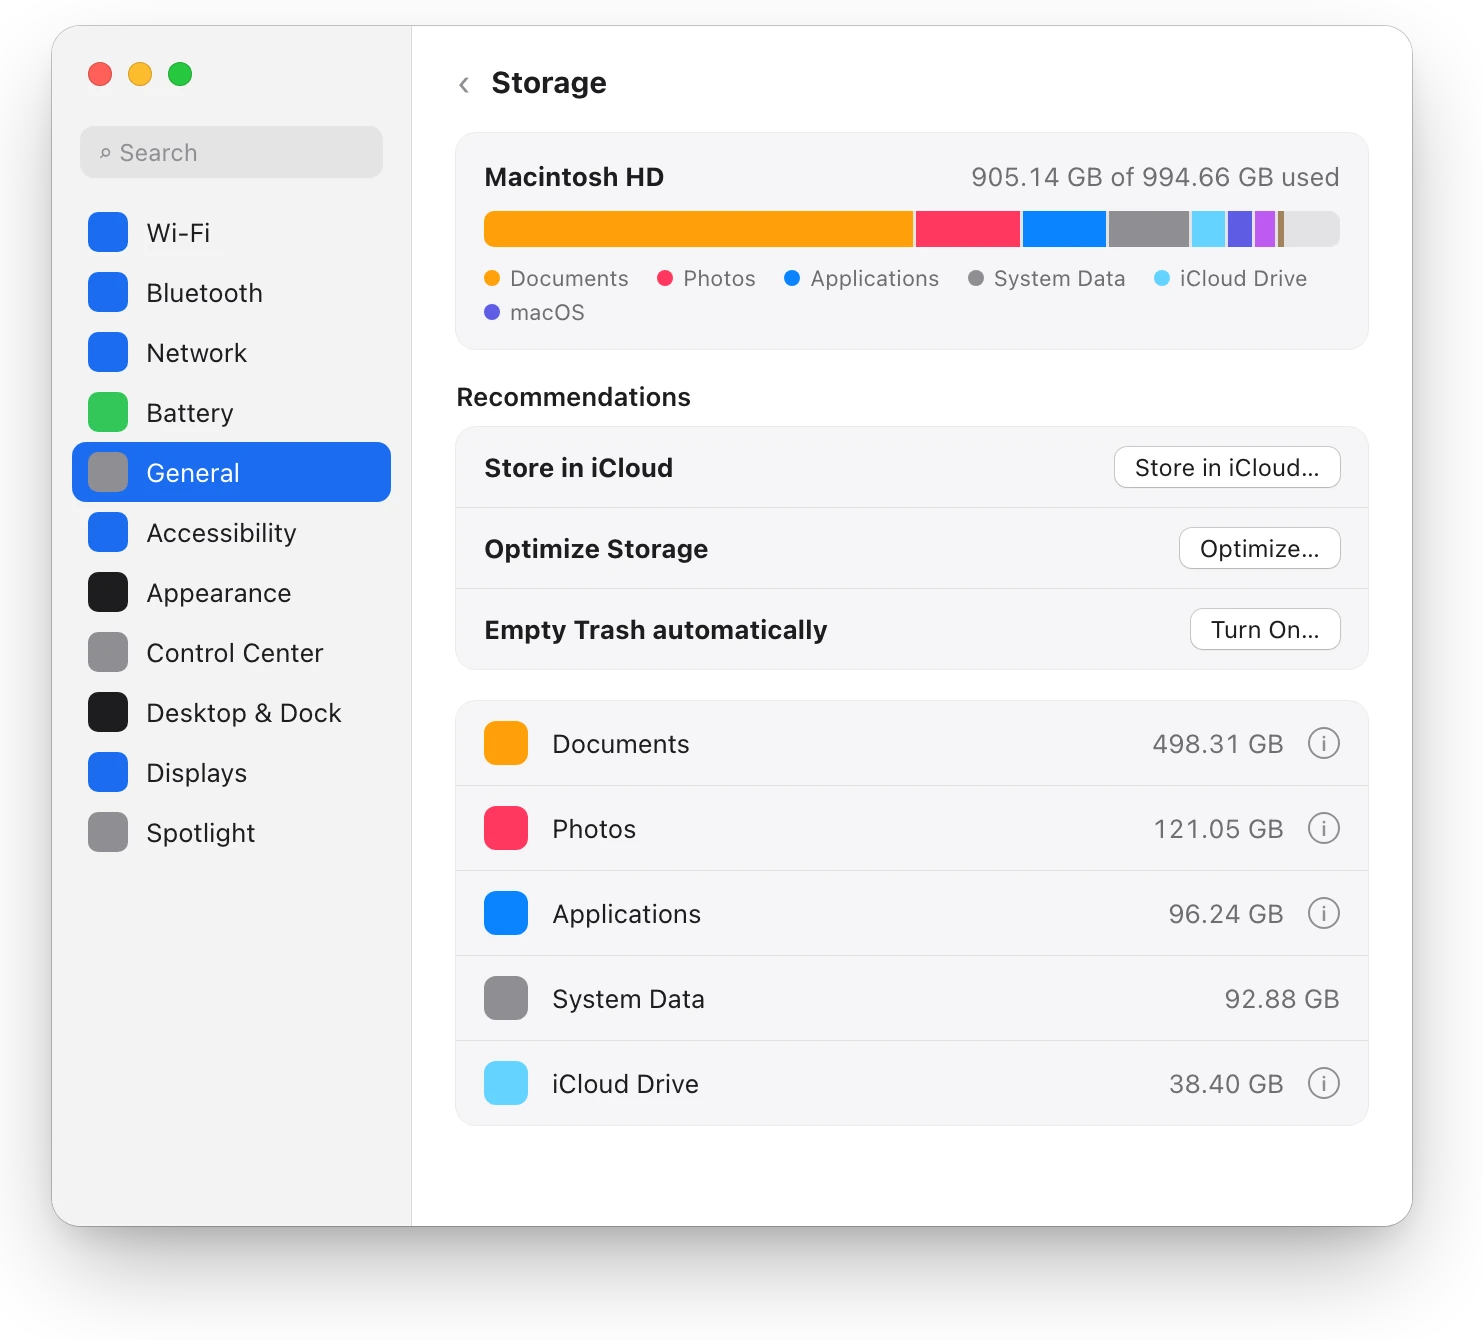
If System Data looks large, What is System Data on a Mac? explains what it holds and what you can do about it.
Is your Mac too hot?
macOS doesn’t show a temperature, so go by touch and sound: the case feels hot, and the fans run fast. A Mac that gets very hot can slow down while it cools. Apple’s developer documentation says that at macOS’s two highest heat levels, performance may be affected, and at the highest level significantly.
- Use your Mac on a stable surface with room for air. Soft surfaces such as beds and pillows block the air vents.
- Keep the room between 10 °C and 35 °C (50 °F and 95 °F), and don’t leave a MacBook in a parked car.
- Check Activity Monitor’s CPU list for an app working hard, as above. A busy processor makes heat.
What else can slow a Mac down?
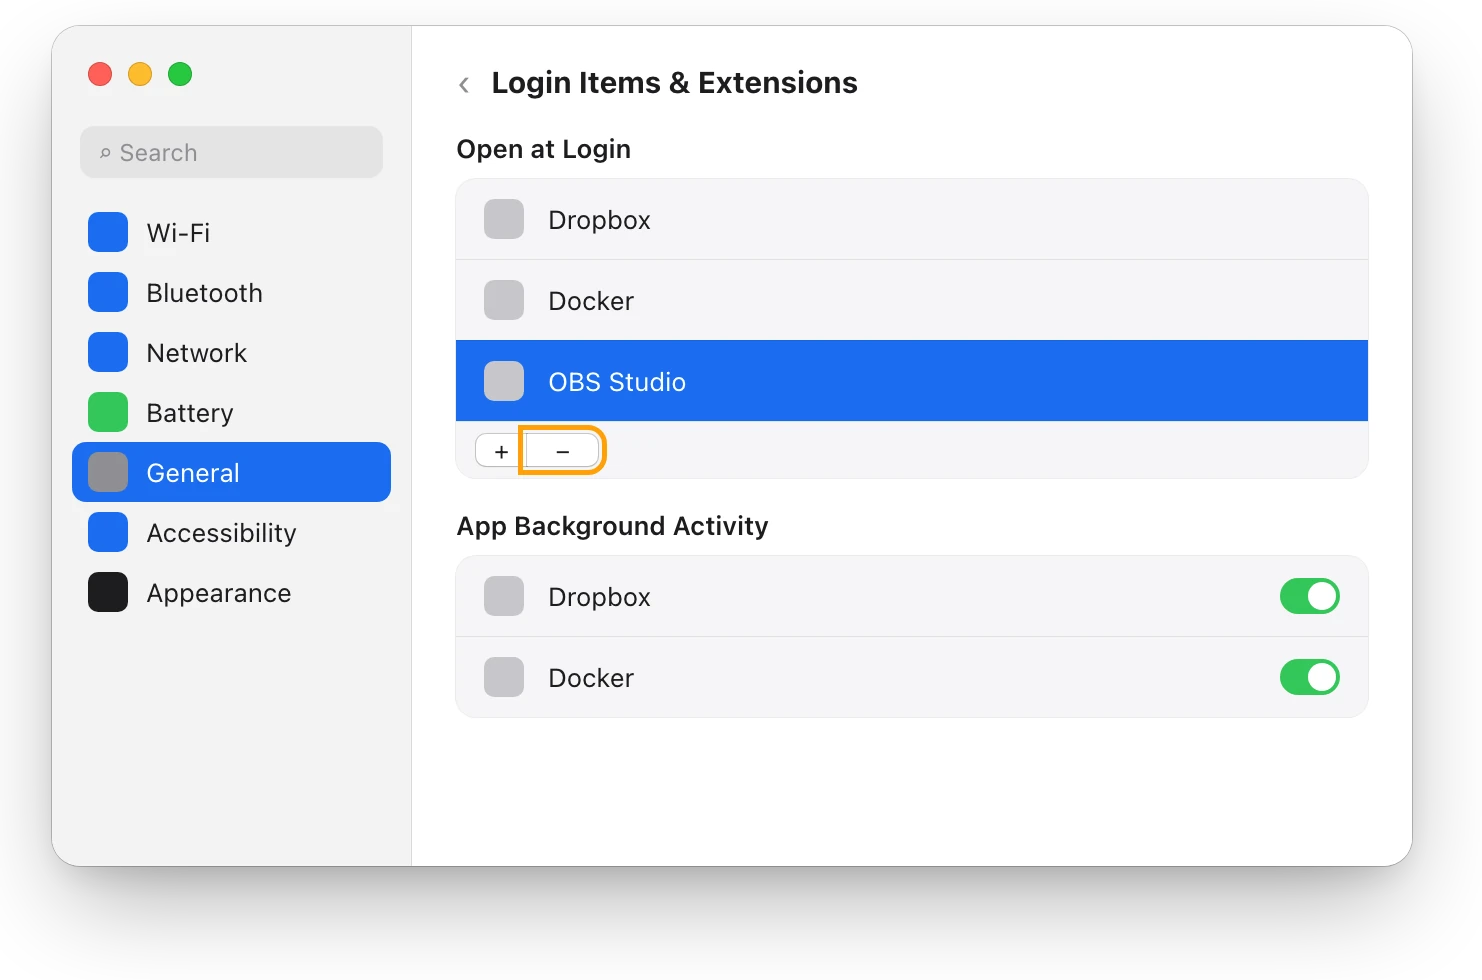
- Apps that open at login. They open every time you log in. To see them, choose Apple menu > System Settings, click General, then click Login Items & Extensions. Select one you don’t need and click the Remove button (−).
- An app not made for your Mac. Apple suggests quitting any app that isn’t compatible with your Mac, for example one that needs a different processor or graphics card. System Settings > General > About shows your chip.
- A problem with the disk. Apple suggests using Disk Utility to check the disk and try to repair it.
- A macOS update that just finished. Spotlight indexes your files again after an update, which Apple says can take hours or even days. Mac slow after a macOS update? covers what’s normal.
Questions people also ask
Why is my Mac slow all of a sudden?
A sudden slowdown usually starts when something begins working in the background, such as an export, a sync or an update. Open Activity Monitor, click CPU and sort by % CPU to see what started. Why is my Mac suddenly slow? has more.
What does the spinning wheel on a Mac mean?
It’s the wait cursor: macOS shows it when an app is delayed by more than a few seconds. If it spins over one app, press Option-Command-Esc to force quit that app; if it spins in every app, the causes above are the usual ones. Spinning wheel on Mac? has the steps.
Is it safe to force quit an app?
Force Quit closes the app at once, so any work you haven’t saved in it is lost. Try Quit first, and use Force Quit only when the app stops responding.
Does high memory use mean my Mac needs more RAM?
No. macOS keeps memory busy on purpose. Memory pressure is what tells you: green is fine, and yellow or red during your normal work means your Mac is short of memory.
Scope for Mac · Free, coming to the Mac App Store
How Scope helps
Scope is a free Mac menu bar app that keeps the readings from these steps in view: how busy the processor is, memory pressure, free disk space and the busiest apps, each explained in one plain sentence. It shows what’s slowing your Mac without opening Activity Monitor or System Settings.
In your menu bar
Scope Free keeps one whole menu bar item of your choice, so a busy processor or a full disk is in view without opening anything.

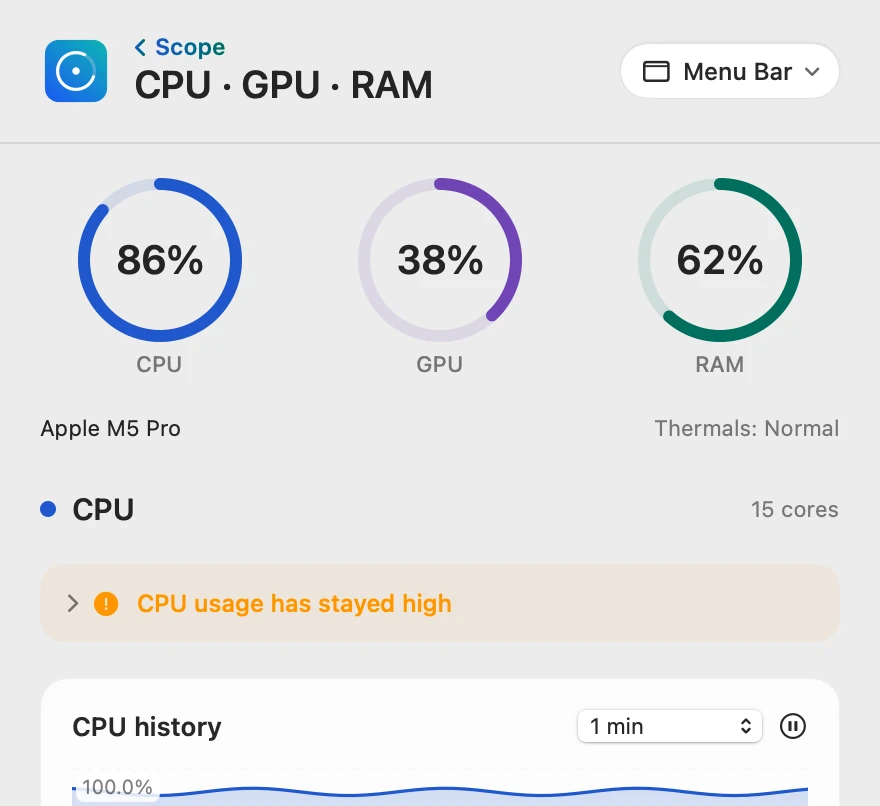
The busy app, in one click
Scope shows each app’s share of the whole processor, so 100% means every core is busy. This Mac has 15 cores, so Activity Monitor’s 978.6% for Blender is 978.6 ÷ 15 = 65.2% here.
Memory and disk, ruled in or out
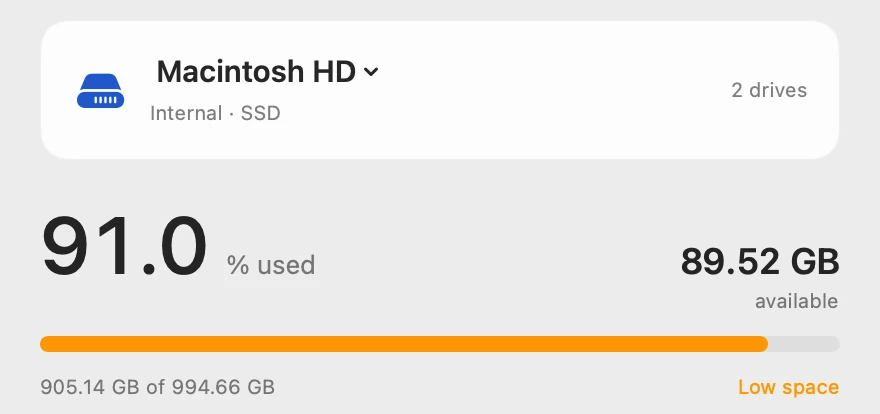
Scope’s RAM pressure is macOS’s own memory pressure level in words: Normal, Warning or Critical, which Activity Monitor shows as green, yellow and red. Scope writes GiB where Activity Monitor writes GB; for memory they’re the same measure. Drive marks Low space once a drive passes your limit, 90% unless you change it.

Told when it lasts, and why
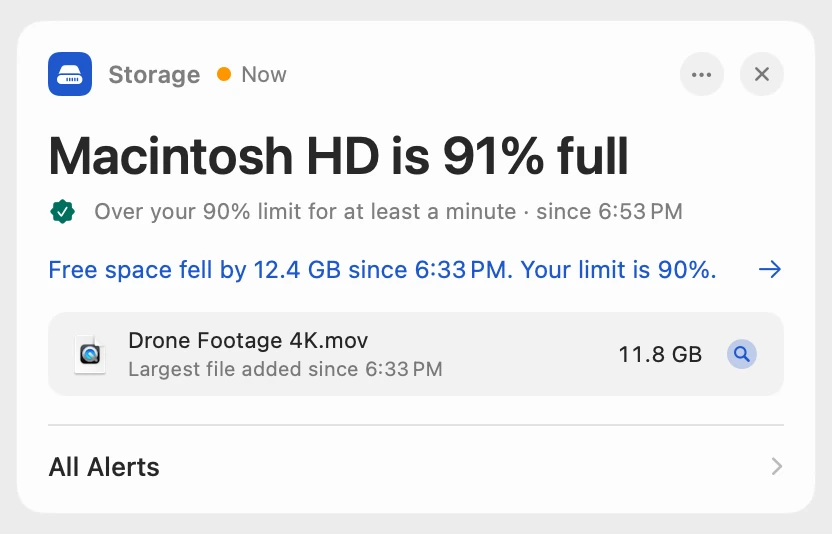
Scope waits until a problem has lasted, so a passing spike never raises an alert. Scope Free shows a lasting problem when you open Scope. Scope Pro adds a red + on its menu bar icon and names what’s behind it, here the 11.8 GB video added since free space began to fall.
Scope shows and explains. It never quits apps, deletes files or changes settings, so what to change stays your call.
Try it here
The real Scope, working, right in this page.
Click any item in the menu bar, or a card inside, as you would on your Mac.
Scope Pro Every menu bar item is shown here. Scope Free keeps one whole item of your choice, with every reading inside.
See what’s slowing your own Mac.
Answers in this guide
Slow Mac
Why is my Mac suddenly slow?
A Mac that turns slow all of a sudden usually has something new keeping it busy. Activity Monitor shows what started; here’s how to find it.
Slow Mac
Which app is slowing down my Mac? How to find it
Activity Monitor shows which app is slowing your Mac: sort by % CPU, then by Memory. Here’s how to read the lists, and what to do next.
Slow Mac
Mac memory pressure: why high RAM use is often fine
Memory pressure, not RAM in use, shows if your Mac has enough memory. Green is fine even when RAM is nearly full; yellow or red means it’s running short.
Slow Mac
Is 8 GB or 16 GB of RAM enough for your Mac?
Memory pressure tells you if your Mac has enough RAM: green on your busiest day means it does. Here’s how to check, and what to buy next.
Slow Mac
What is swap on a Mac, and when should you worry?
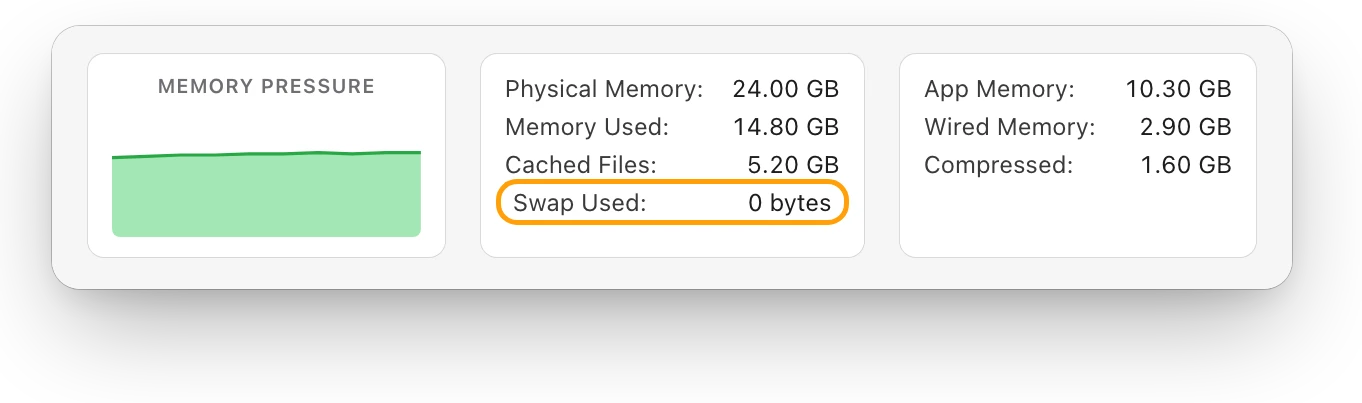
Swap is startup-disk space macOS uses to make room in RAM. Some is normal; it matters when memory pressure is yellow or red and Swap Used keeps growing.
Slow Mac
Why is Chrome using so much memory on a Mac?
Chrome runs tabs and parts of the browser as separate processes, so its memory adds up. Here’s how to see it on a Mac, and when it matters.
Slow Mac
Mac slow after a macOS update? What’s normal
After a macOS update, Spotlight indexes your Mac again, which Apple says can take hours or days. Keep it on power; if it stays slow, check apps and space.
Slow Mac
Spinning wheel on Mac? What it means and what to do
The spinning wheel means an app is busy. Wait, then force quit it with Option-Command-Esc. If every app spins, Activity Monitor shows why.
Slow Mac
How to check CPU usage on a Mac
Check CPU usage on a Mac in Activity Monitor’s CPU tab. Here’s what % CPU, System, User and Idle mean, why a process can pass 100%, and other ways to look.
Slow Mac
Mac CPU, GPU and RAM monitor for your menu bar
Scope shows your Mac’s CPU, GPU and RAM use, macOS’s heat level and the apps using the most, right from the menu bar. Free on the Mac App Store.
Slow Mac
How to free up RAM on a Mac, and when not to
Check memory pressure first. If it’s yellow or red, quit the app using the most memory, close tabs or restart. If it’s green, there’s nothing to free.
Slow Mac
How to stop apps opening at startup on a Mac
Stop apps opening at startup in System Settings > General > Login Items & Extensions: select the app and click Remove. Background items and windows too.
Slow Mac
How to speed up a Mac: what actually helps
Speed up a Mac by fixing the real cause: quit the busy app, free memory or disk space, keep it cool, trim login items. What helps most, and what doesn’t.
Slow Mac
WindowServer using high CPU on a Mac? What it means
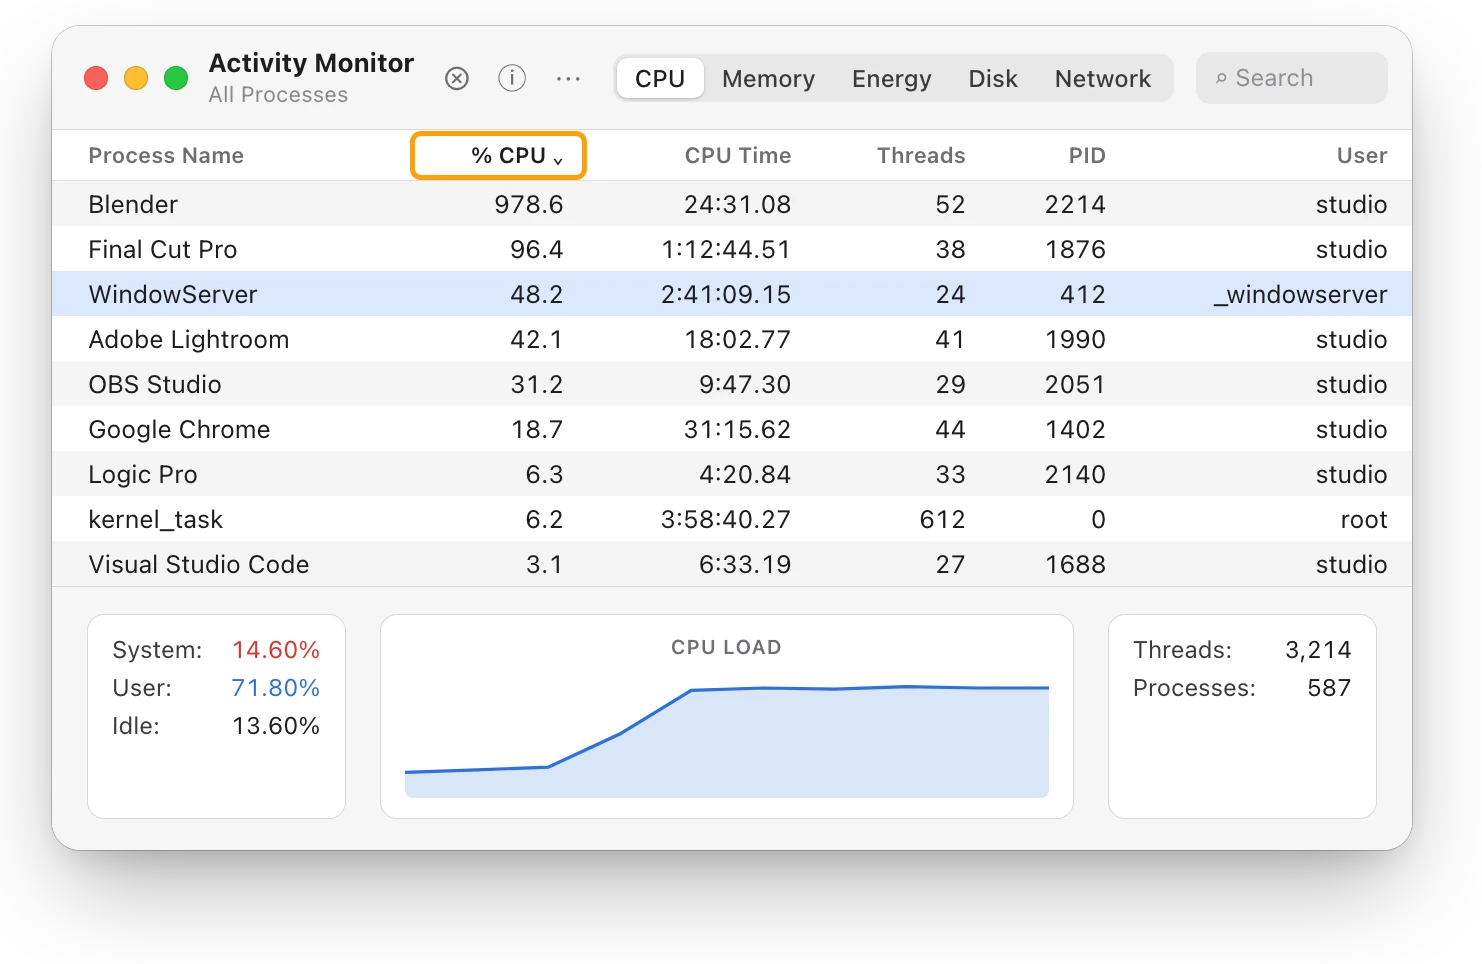
WindowServer is the part of macOS that puts your apps’ windows on screen. If its CPU stays high, look for the busy apps and close what you don’t need.
Keep reading
Guide · Heat
Mac overheating? Every cause and what to do
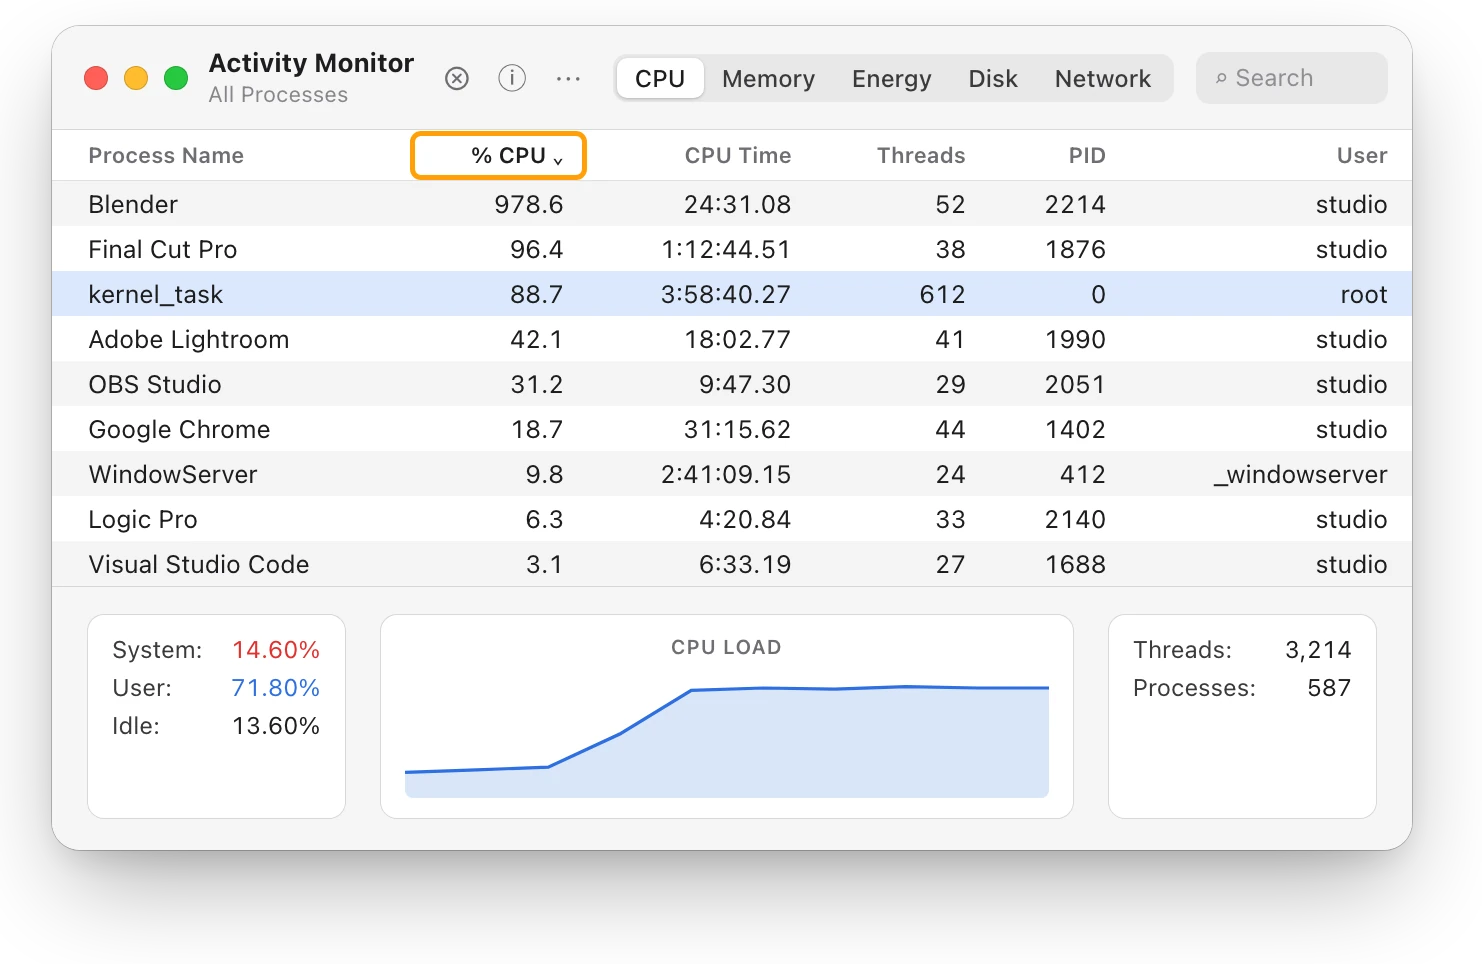
A Mac overheats when an app keeps the processor busy, the vents can’t move air or the room is too warm. Here’s how to find the cause and cool it down.
Guide · Storage
Mac storage full? Where your space went
When Mac storage is full, Storage in System Settings shows what’s using it. Here’s where the space usually goes, and how to get it back safely.
Storage
What is System Data on a Mac, and why is it so big?
System Data holds files no other Storage category claims, such as caches, logs and temporary files. You can’t delete it directly; here’s what helps.
Sources
- Apple Support: If your Mac runs slowly
- Apple Support: Check if your Mac needs more RAM in Activity Monitor
- Apple Support: View information about Mac processes in Activity Monitor
- Apple Support: Quit a process in Activity Monitor on Mac
- Apple Support: Optimize storage space on your Mac
- Apple Support: Free up storage space on Mac
- Apple Support: Keep your Mac laptop within acceptable operating temperatures
- Apple Support: Open items automatically when you log in on Mac
- Apple Developer: ProcessInfo.ThermalState
Last checked October 19, 2026. Readings, apps and files in the pictures are from a made-up Mac.