Activity Monitor on a Mac: every tab explained
Activity Monitor on a Mac is the built-in app that shows what every process is using right now. Its tabs, CPU, Memory, Energy, Disk and Network, each list the processes by one resource, and the bottom of the window gives the totals for the whole Mac. Activity Monitor is in Applications > Utilities.
A process is a program at work: an app, a helper an app runs, or a part of macOS. To open Activity Monitor or quit an app, see Task Manager on a Mac.
What does each tab in Activity Monitor show?
| Tab | The list shows | The bottom of the window shows | Use it to |
|---|---|---|---|
| CPU | Each process’s share of the processor | System, User and Idle, plus threads and processes | Find what’s keeping the processor busy |
| Memory | How much memory each process uses | Memory Pressure, Memory Used, Cached Files, Swap Used | See whether your Mac has enough memory |
| Energy | Each app’s Energy Impact | Charge, time remaining and the last 12 hours of battery, on a Mac laptop | Find what’s using the battery |
| Disk | How much each process reads and writes | Reads, writes and data moved for the whole Mac | Find what’s busy on the disk |
| Network | How much each process sends and receives | Packets and data in and out | Find what’s using the connection |
A Cache tab also appears when Content Caching is turned on in System Settings > General > Sharing.
In every tab, click a column heading to sort the list, and click the arrow in it to reverse the order. To find one app, type its name in the search field.
What does the CPU tab show?
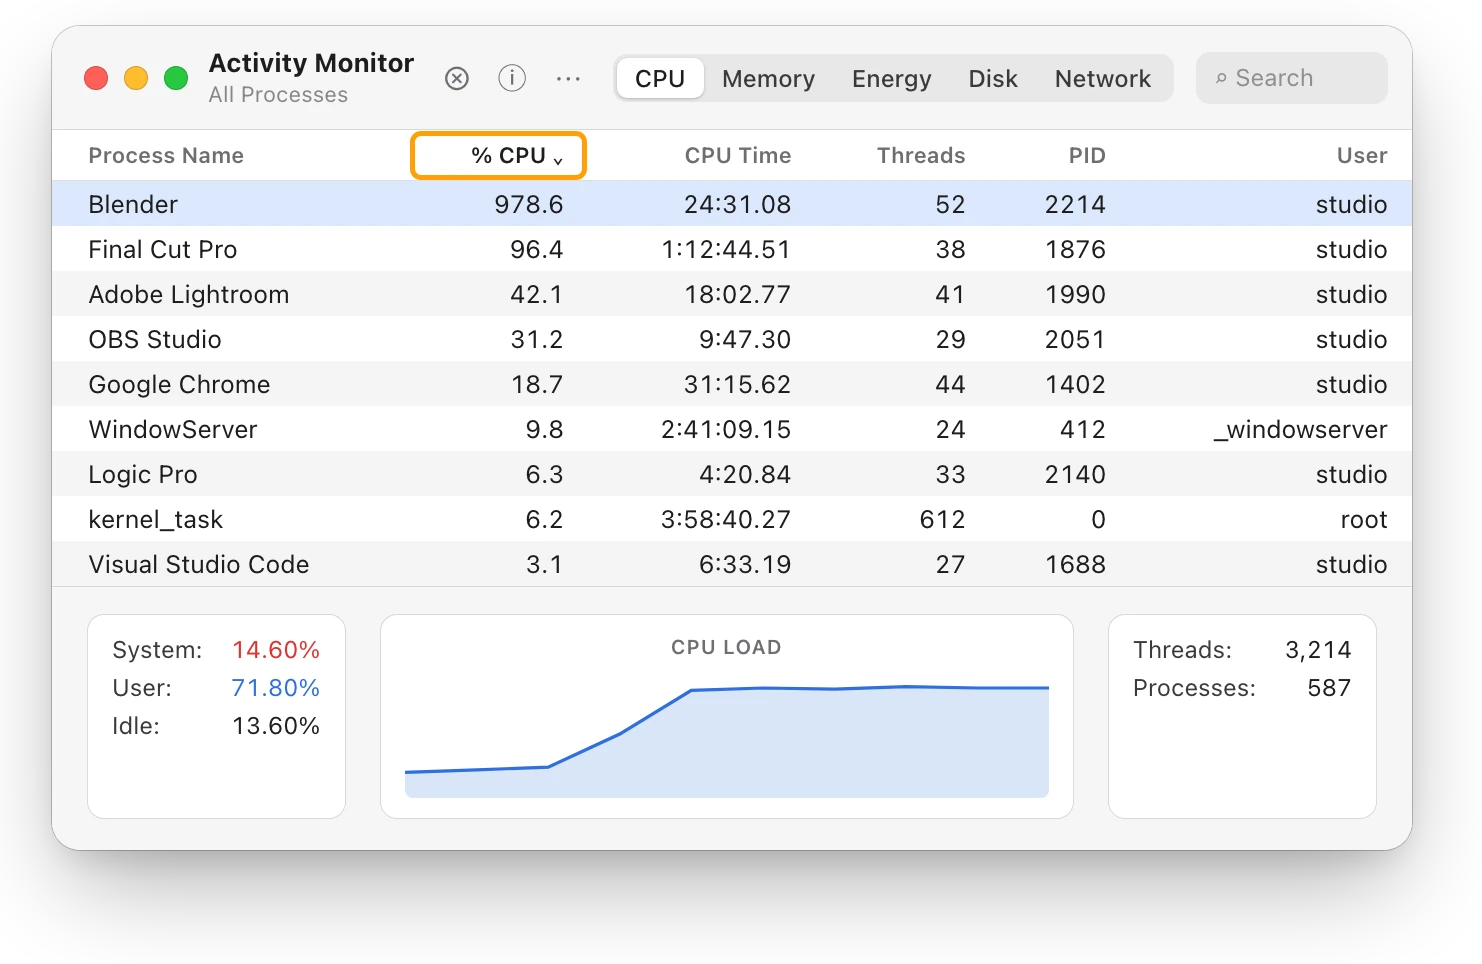
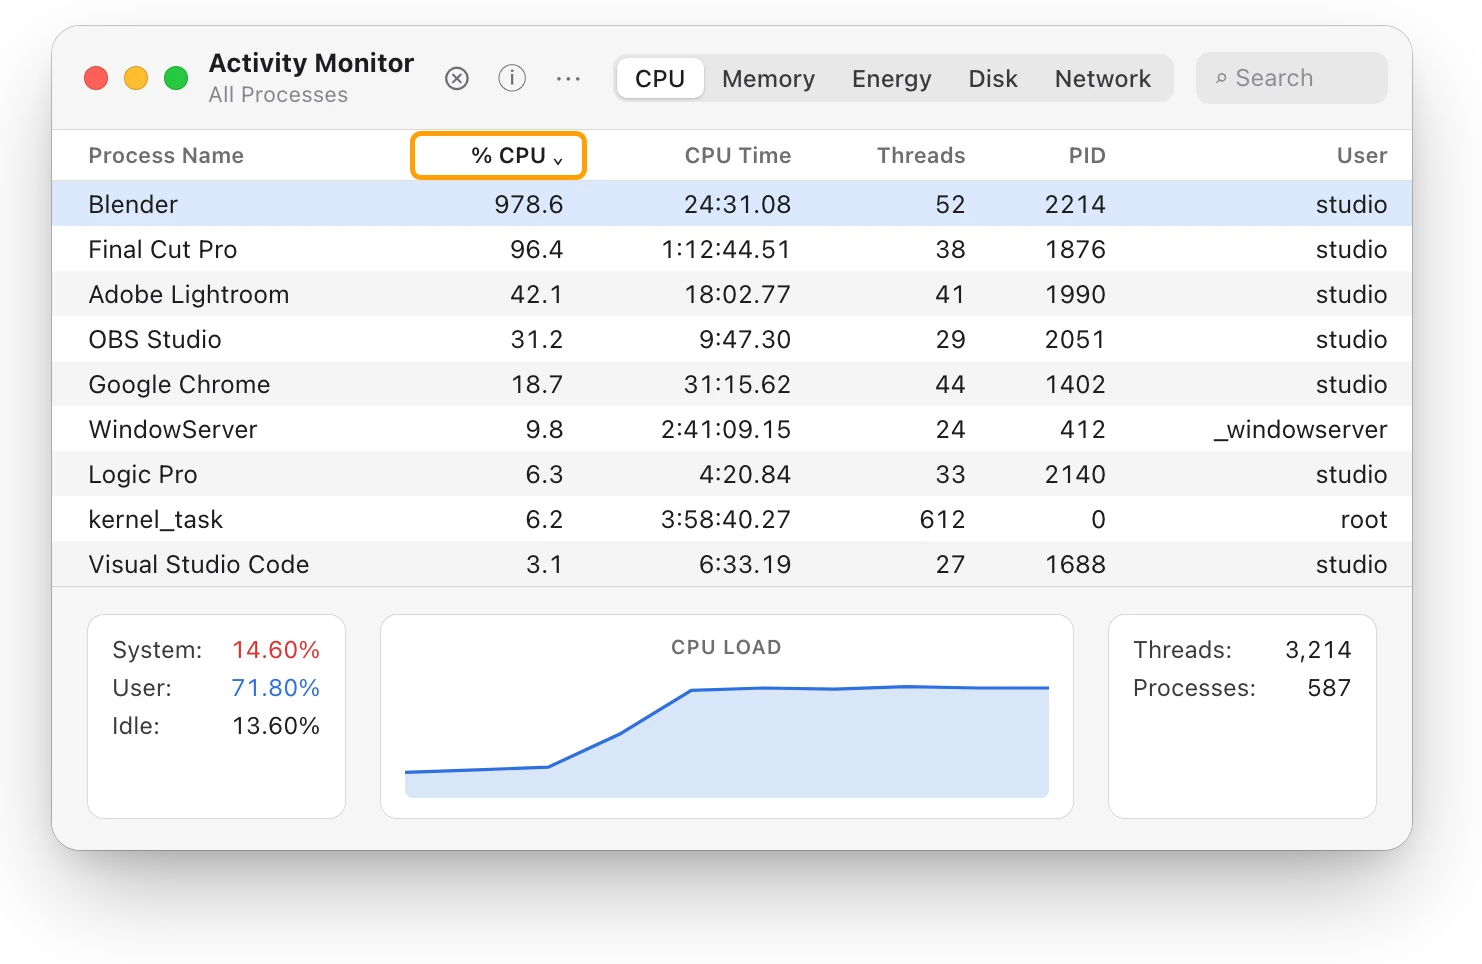
The CPU tab shows how much of the processor each process uses. Click % CPU to put the busiest at the top.
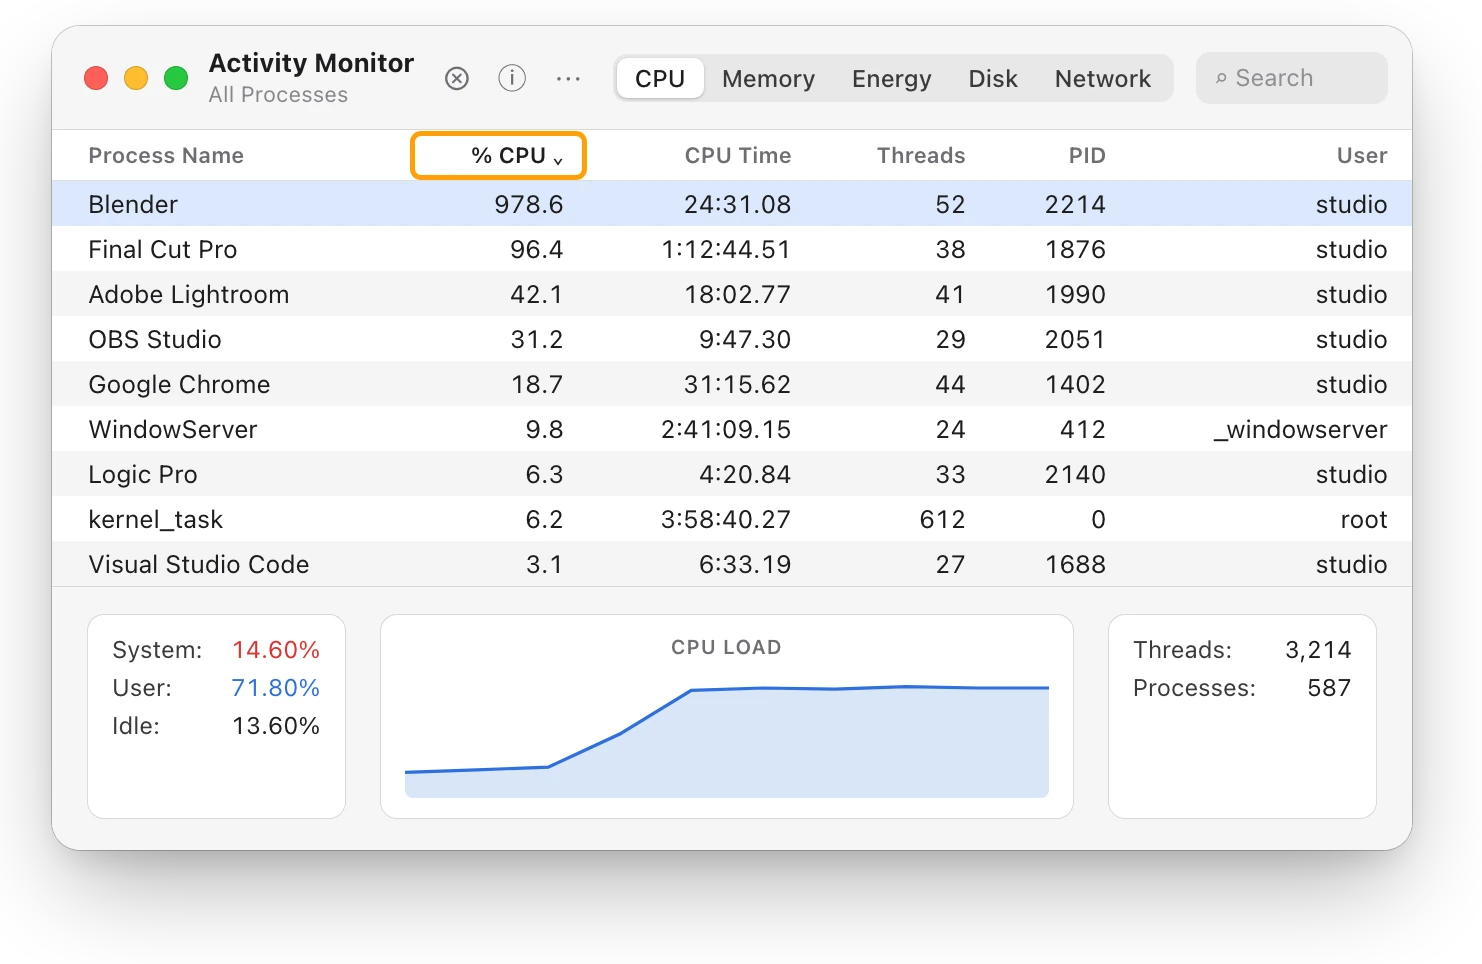
- % CPU: the process’s share of the processor right now. Activity Monitor counts each core as 100%, so on this 15-core MacBook Pro one process can show up to 1,500%.
- CPU Time: the processor time the process has used.
At the bottom:
- System: the share of the processor used by processes that belong to macOS.
- User: the share used by apps you opened, and the processes those apps opened.
- Idle: the share that isn’t being used.
- Threads and Processes: how many are open now.
Here Idle is 13.60%, so the processor is working hard. How to check CPU usage on a Mac explains these numbers.
What does the Memory tab show?
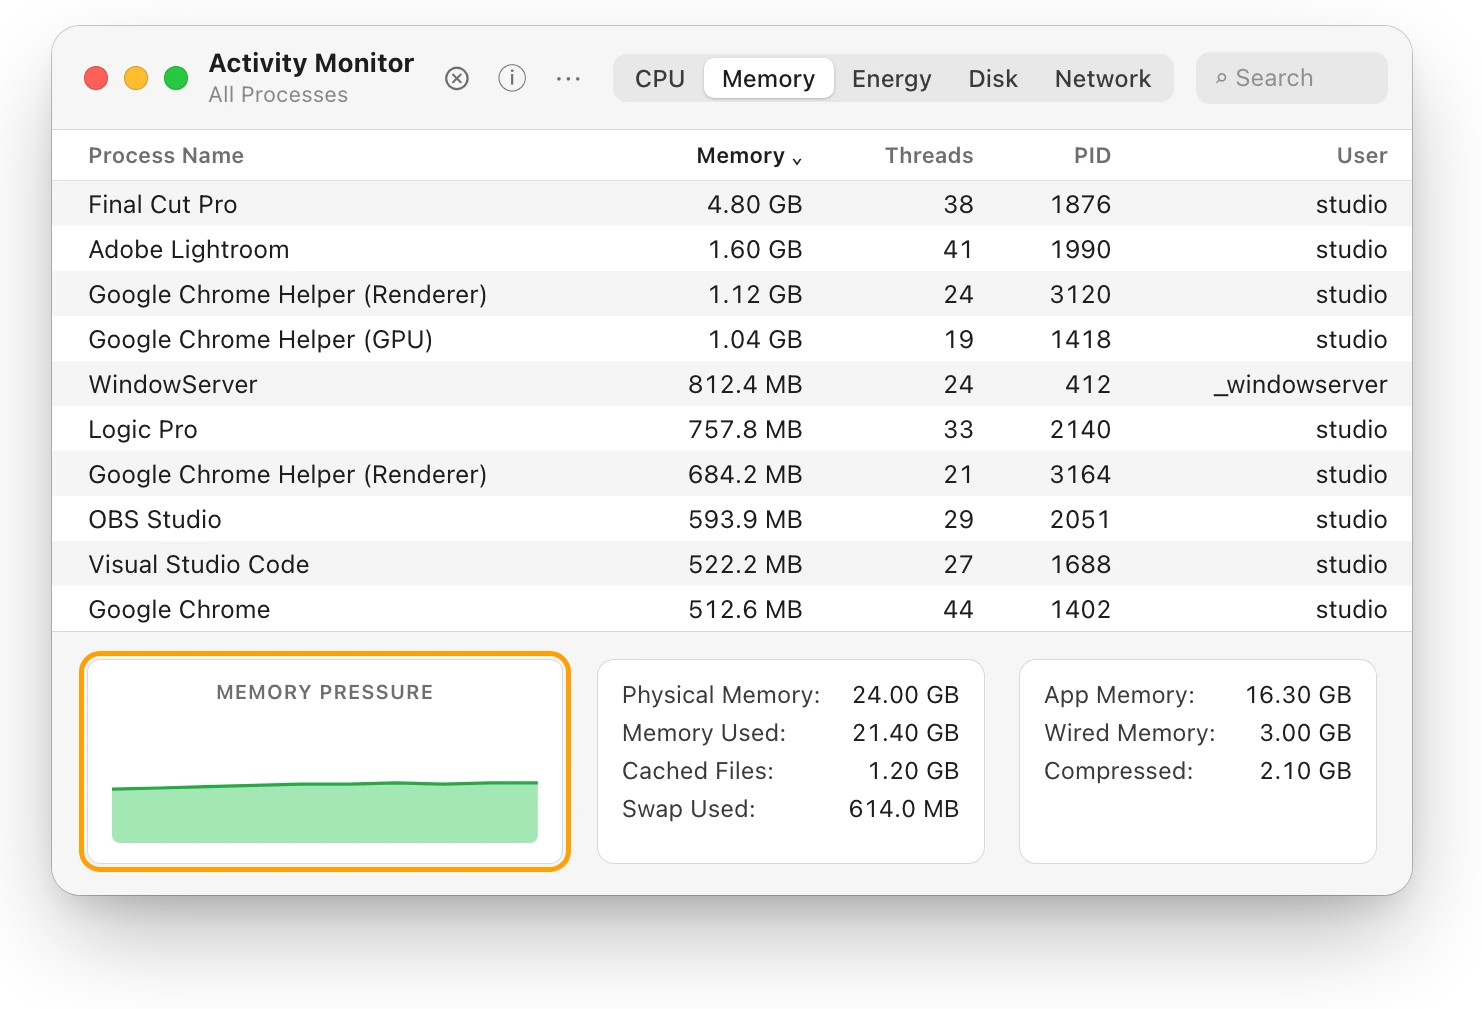
The Memory tab shows how much memory, or RAM, each process uses, and how well your Mac is coping. The bottom of the window matters more than the list.
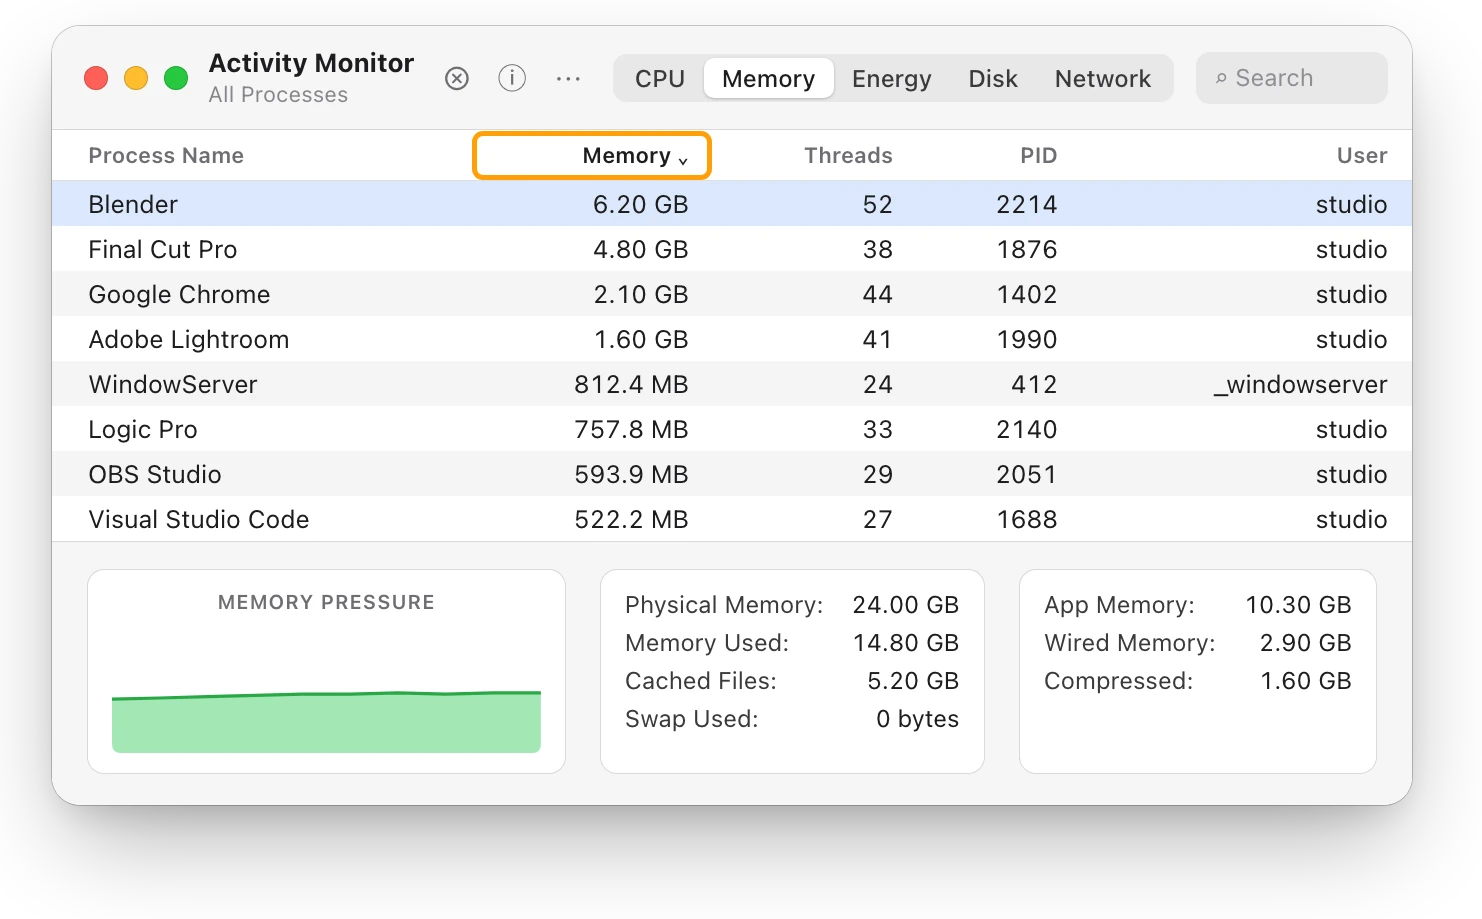
- Memory Pressure: a graph of how well your memory is serving your Mac. Green means your Mac is using its memory efficiently, yellow means it might eventually need more, and red means it needs more.
- Physical Memory: the RAM installed, here 24.00 GB.
- Memory Used: the RAM in use. Beside it, Activity Monitor shows where that memory goes:
- App Memory: used by apps (10.30 GB here);
- Wired Memory: what macOS needs to run, which must stay in RAM (2.90 GB);
- Compressed: memory squeezed to make room for active apps (1.60 GB).
- Cached Files: files macOS keeps in unused memory, so they open faster next time. They stay there until that memory is overwritten.
- Swap Used: space on the startup disk used to swap memory in and out of RAM. Here it’s 0 bytes.
High Memory Used on its own is fine. Apple says free memory doesn’t necessarily make your Mac faster: macOS performs best when it uses and manages all of its memory. Mac memory pressure explains when to worry.
What does the Energy tab show?
The Energy tab shows how much power each app is using. On a Mac laptop, the bottom of the window also shows the battery.
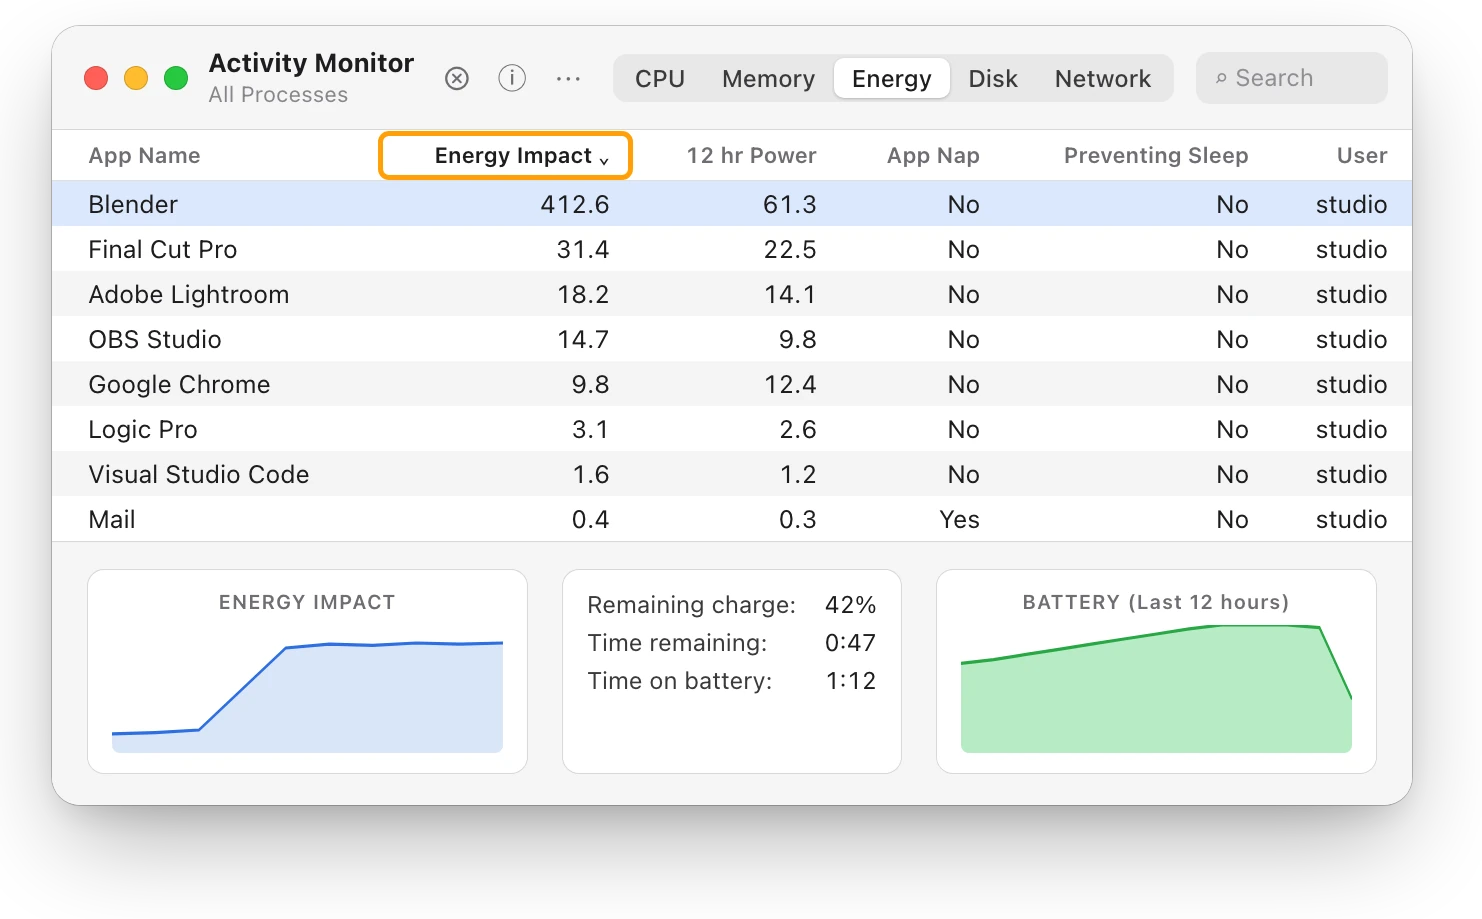
- Energy Impact: a relative measure of the app’s energy use right now. Lower is better.
- 12 hr Power: the app’s average energy impact over the last 12 hours, or since your Mac started. It appears only on Mac laptops.
- App Nap: whether App Nap is on for the app. App Nap slows down apps that sit in the background with nothing to do.
- Preventing Sleep: whether the app is keeping your Mac awake.
- User: the account running the process.
At the bottom, a Mac laptop shows Remaining charge, Time remaining (Time until full when plugged in), Time on battery (Time on AC) and the battery’s last 12 hours.
What does the Disk tab show?
The Disk tab shows how much each process reads from and writes to your disks. Apple says Activity Monitor counts how many times your Mac reads from and writes to the disk, and how much data it reads and writes.
To see the busiest process, sort the list by the amount it writes or reads. For a live graph of disk activity in the Dock, choose View > Dock Icon > Show Disk Activity.
What does the Network tab show?
The Network tab shows how much each process sends and receives over your network connections.
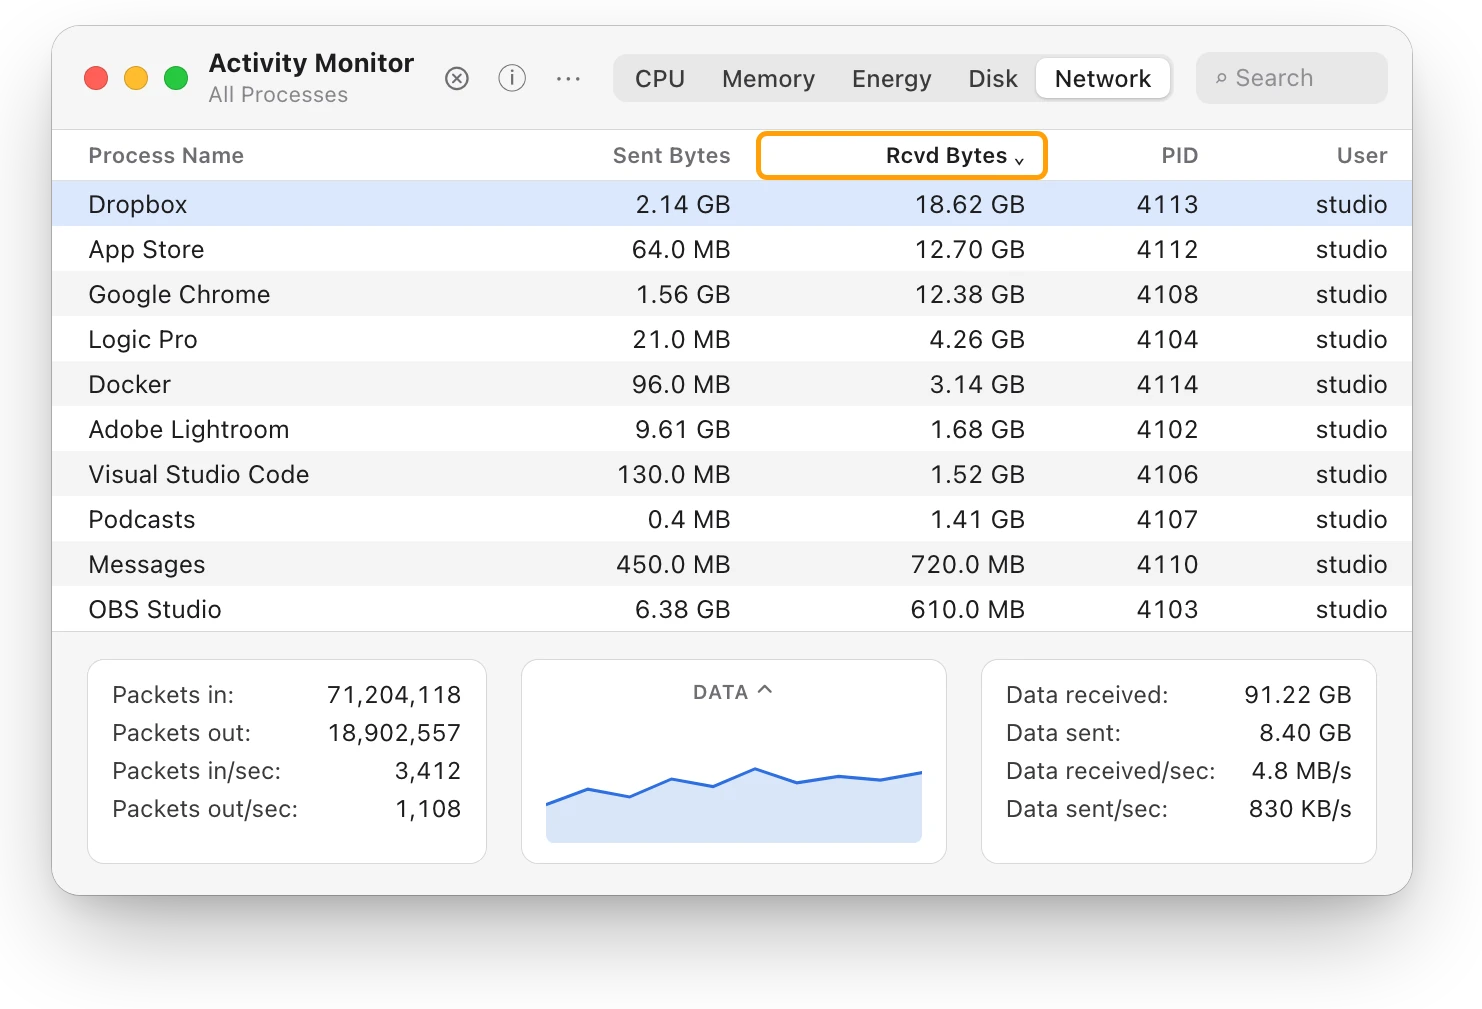
At the bottom:
- Packets in, Packets out: how many packets, small pieces of data, your Mac has received and sent.
- Packets in/sec, Packets out/sec: packets per second, right now.
- Data received, Data sent: the total amount of data moved.
- Data received/sec, Data sent/sec: how much data moves each second, also called throughput.
To change what the graph shows, click the pop-up menu above it, then choose Packets or Data. How much data does my Mac use? goes further.
What do the View menu options do?
The View menu changes which processes the list shows, how often it updates and what the Dock icon shows.
| View menu item | What it does |
|---|---|
| All Processes | Shows every process on your Mac |
| All Processes, Hierarchically | Shows each process under the one that opened it |
| My Processes | Shows processes owned by your user account |
| System Processes | Shows processes owned by macOS |
| Windowed Processes | Shows processes that can open a window, usually apps |
| Applications in last 12 hours | Shows only apps that ran in the last 12 hours |
| Columns | Choose which columns each tab shows |
| Dock Icon | Show CPU, disk or network activity in the Dock icon |
| Update Frequency | Choose how often the numbers refresh |
Windowed Processes is the simplest view: mostly the apps you opened. Update Frequency is every 5 seconds by default; Apple notes that updating more often may affect your Mac’s performance.
Dock Icon turns Activity Monitor’s Dock icon into a live graph: choose View > Dock Icon, then choose a Show CPU option, Show Disk Activity or Show Network Usage.
How do I see the CPU and GPU history?
Activity Monitor has three small windows for the processor and the graphics processor (GPU):
- Window > CPU Usage shows current processor activity.
- Window > CPU History shows recent processor activity.
- Window > GPU History shows how hard the GPU has been working.
Apple suggests checking GPU History when your Mac feels hot or the battery drains quickly. Many tall blue bars packed tightly together mean the GPU has been working hard.
What does the ⓘ button do?
The ⓘ (Info) button opens a window with more information about one process.
- Select the process in any tab.
- Click the Info button (ⓘ) in the toolbar, or double-click the process.
The ⋯ button beside it creates reports you can save and send to Apple Support, such as Sample Process (the selected process over 3 seconds) and System Diagnostics (from your Mac’s logs).
The Stop button (⊗) quits the selected process. Task Manager on a Mac explains Quit and Force Quit.
Questions people also ask
Is it safe to use Activity Monitor?
Yes. Looking changes nothing. Only the Stop button quits a process, and Force Quit can lose unsaved work, so leave macOS’s own processes, such as kernel_task and WindowServer, alone.
Does Activity Monitor slow down my Mac?
Not at its normal setting. Apple notes that choosing a faster Update Frequency may affect overall performance, and the CPU Time column shows how much processor time Activity Monitor itself uses.
Why does Activity Monitor show so many processes I didn’t open?
Most belong to macOS or to apps’ helpers. Choose View > Windowed Processes to see mostly the apps you opened, or View > All Processes, Hierarchically to see which app each helper belongs to.
Scope for Mac · Free, coming to the Mac App Store
How Scope helps
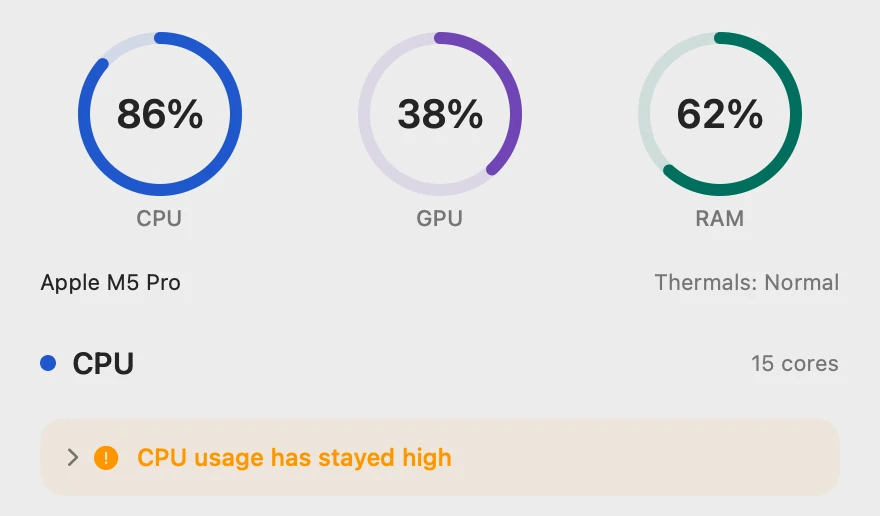
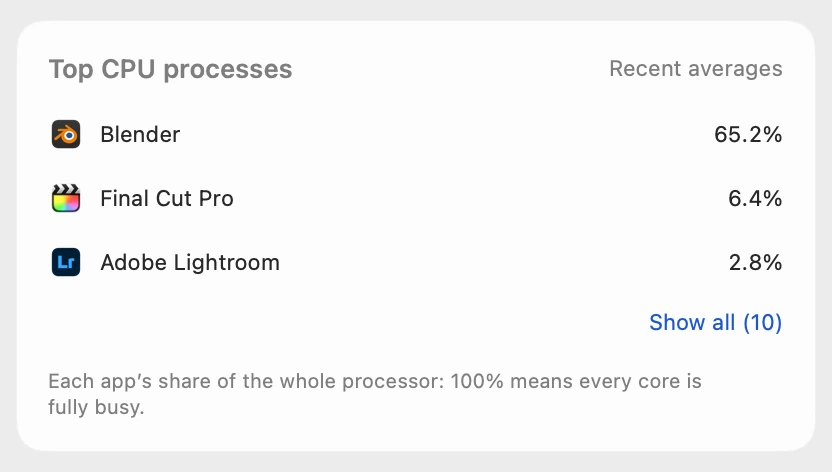
Scope is a free Mac menu bar app that keeps the main readings from Activity Monitor’s tabs one click away: CPU, GPU and RAM with the busiest processes, your disk’s free space and live read and write speeds, and live download and upload with the apps using the network. Each reading comes with a plain sentence explaining it.
In your menu bar
Scope Free keeps one whole menu bar item of your choice: CPU · GPU · RAM, Drive, Network or Battery.

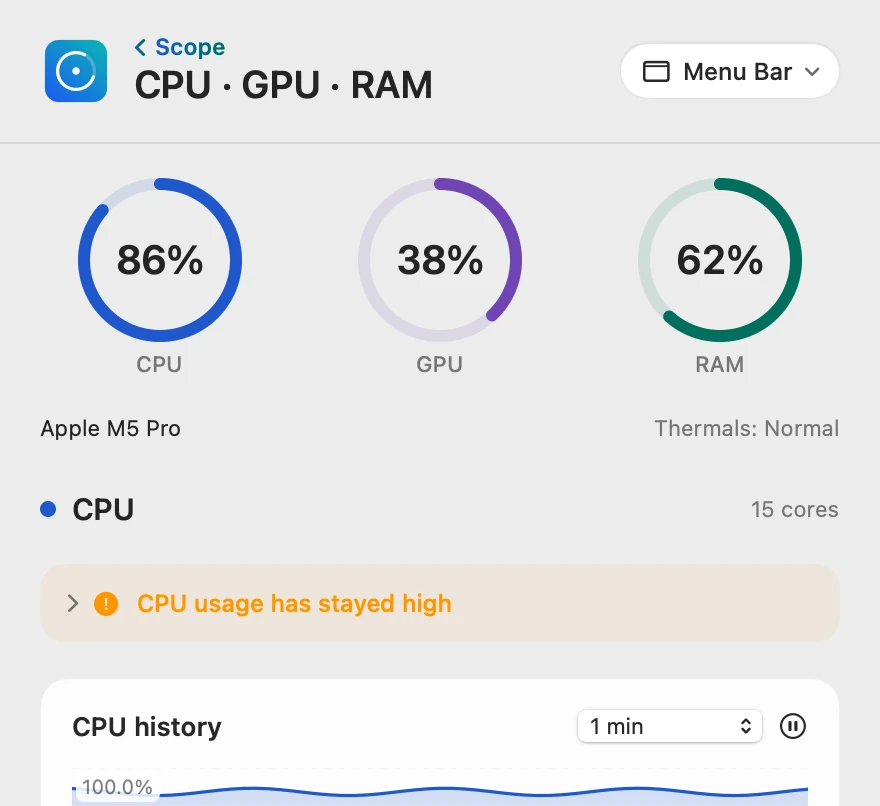
The CPU and Memory tabs, at a glance
Scope shows each process’s share of the whole processor, so Blender’s 978.6% on 15 cores is 978.6 ÷ 15 = 65.2%. Like Windowed Processes, its lists show the apps you run, not macOS’s background processes.
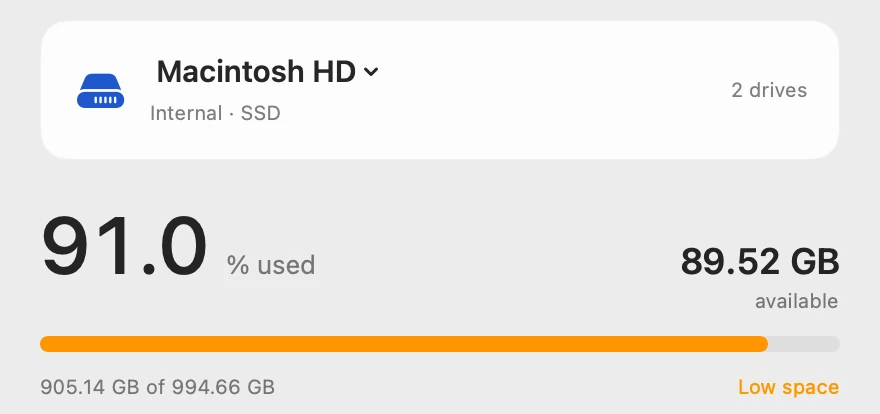
The Disk tab, as space and speed
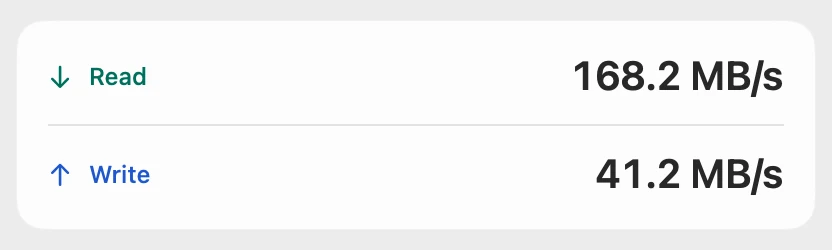
Scope’s Drive panel also shows what Activity Monitor doesn’t: how full each drive is, beside its live speeds.
The Network tab, by app
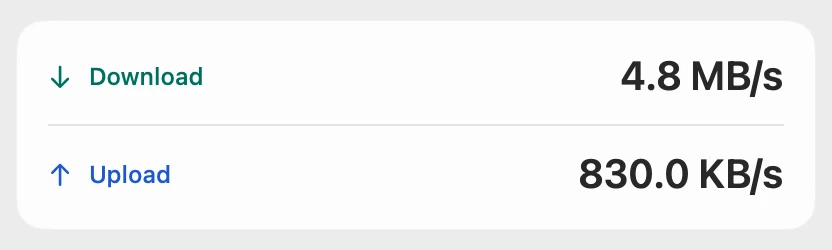
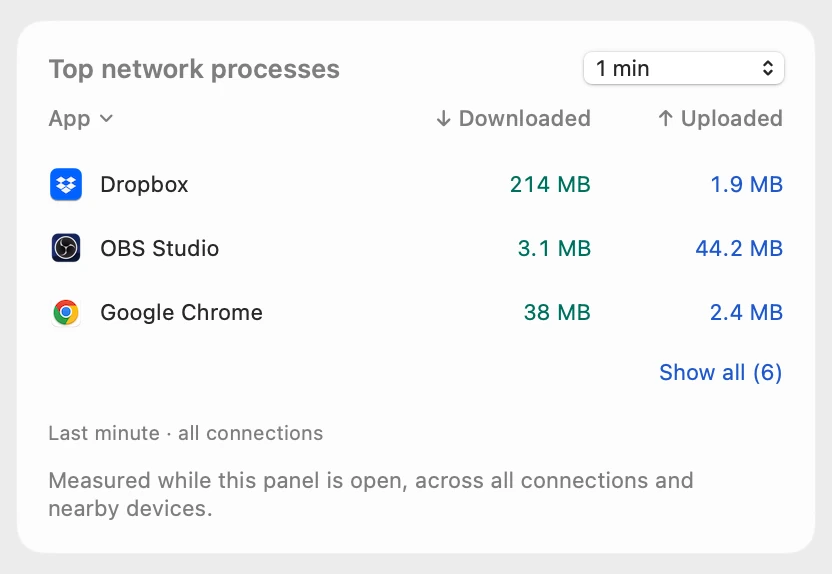
Scope shows what each app downloaded and uploaded over the last minute. Scope Pro shows any range up to 24 hours.
Scope shows and explains. It never quits, cleans or changes anything; that stays your call, in Activity Monitor.
Try it here
The real Scope, working, right in this page.
Click any item in the menu bar, or a card inside, as you would on your Mac.
Scope Pro Every menu bar item is shown here. Scope Free keeps one whole item of your choice, with every reading inside.
See what your own Mac is doing.
Keep reading
Your Mac
Task Manager on a Mac: how to open it
The Mac’s Task Manager is Activity Monitor. Open it with Spotlight, quit a frozen app with Option-Command-Esc, and see what replaces each Windows tool.
Slow Mac
How to check CPU usage on a Mac
Check CPU usage on a Mac in Activity Monitor’s CPU tab. Here’s what % CPU, System, User and Idle mean, why a process can pass 100%, and other ways to look.
Slow Mac
Which app is slowing down my Mac? How to find it
Activity Monitor shows which app is slowing your Mac: sort by % CPU, then by Memory. Here’s how to read the lists, and what to do next.
Slow Mac
Mac memory pressure: why high RAM use is often fine
Memory pressure, not RAM in use, shows if your Mac has enough memory. Green is fine even when RAM is nearly full; yellow or red means it’s running short.
Sources
- Apple Support: Activity Monitor User Guide
- Apple Support: View information about Mac processes in Activity Monitor
- Apple Support: View CPU activity in Activity Monitor on Mac
- Apple Support: View GPU activity in Activity Monitor on Mac
- Apple Support: View memory usage in Activity Monitor on Mac
- Apple Support: Check if your Mac needs more RAM in Activity Monitor
- Apple Support: View energy consumption in Activity Monitor on Mac
- Apple Support: View disk activity in Activity Monitor on Mac
- Apple Support: View network activity in Activity Monitor on Mac
- Apple Support: View cache activity in Activity Monitor on Mac
- Apple Support: Change how often information is updated in Activity Monitor on Mac
- Apple Support: Run system diagnostics in Activity Monitor on Mac
- Apple Support: Quit an app or process in Activity Monitor on Mac
- Apple Support: App Nap (Mac User Guide glossary)
Last checked October 18, 2026. Readings, apps and files in the pictures are from a made-up Mac.