Which app is slowing down my Mac? How to find it
To find the app slowing down your Mac, open Activity Monitor, click CPU and sort the list by % CPU, then click Memory and sort by Memory. An app that stays at the top of either list for minutes, not seconds, is the one to look at. Quitting that app, or letting its work finish, gives the rest of your Mac room again.
How do I find the app using the most CPU?
The CPU list shows how much of the processor each app is using right now.
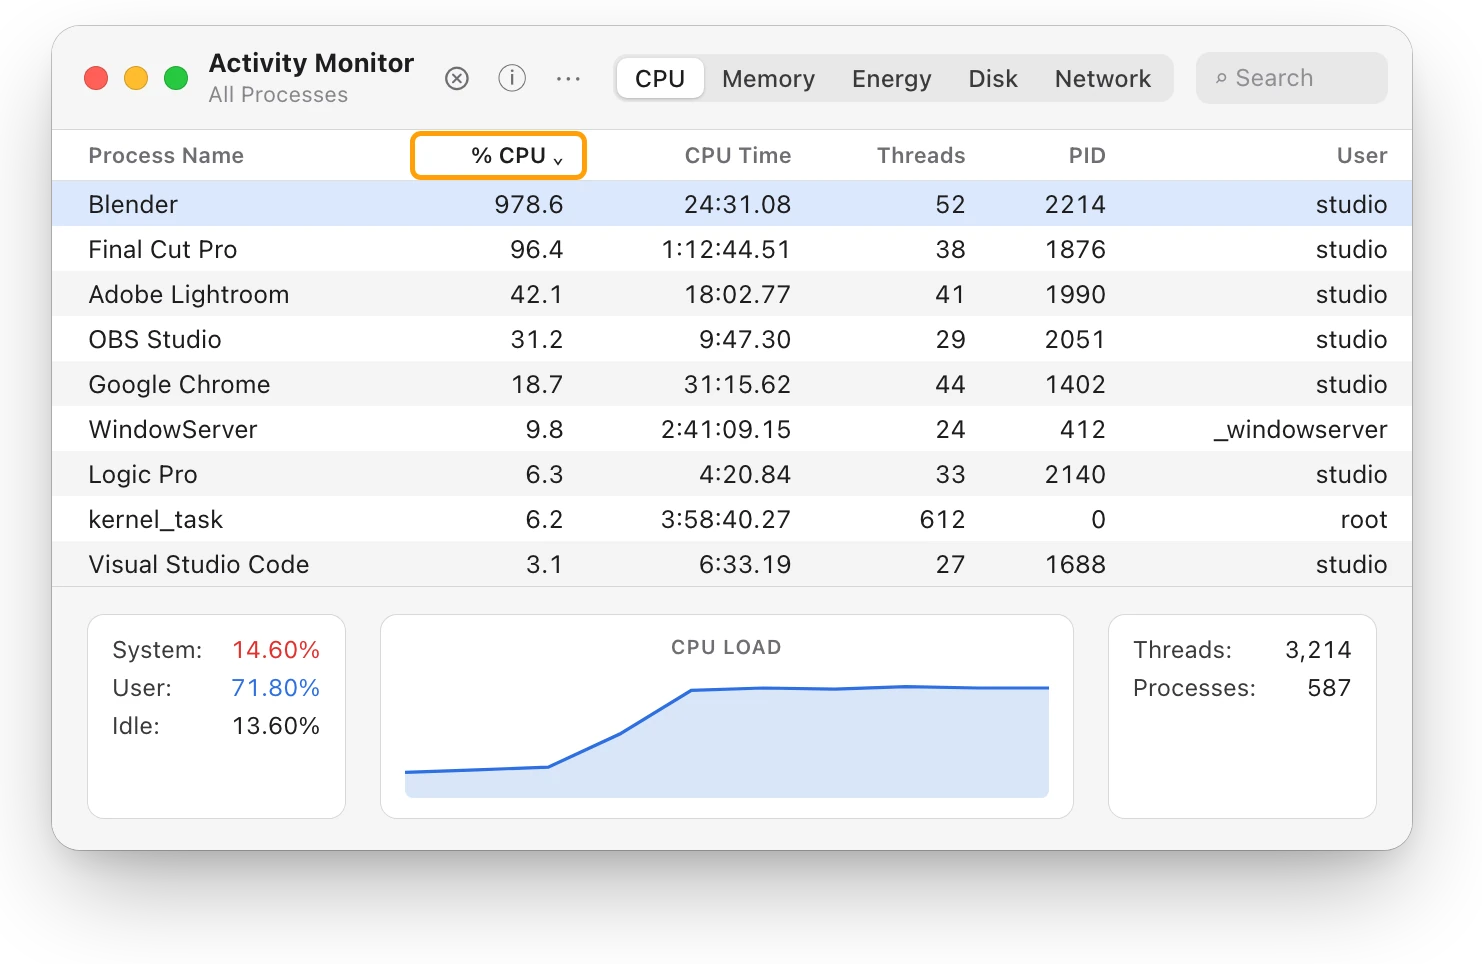
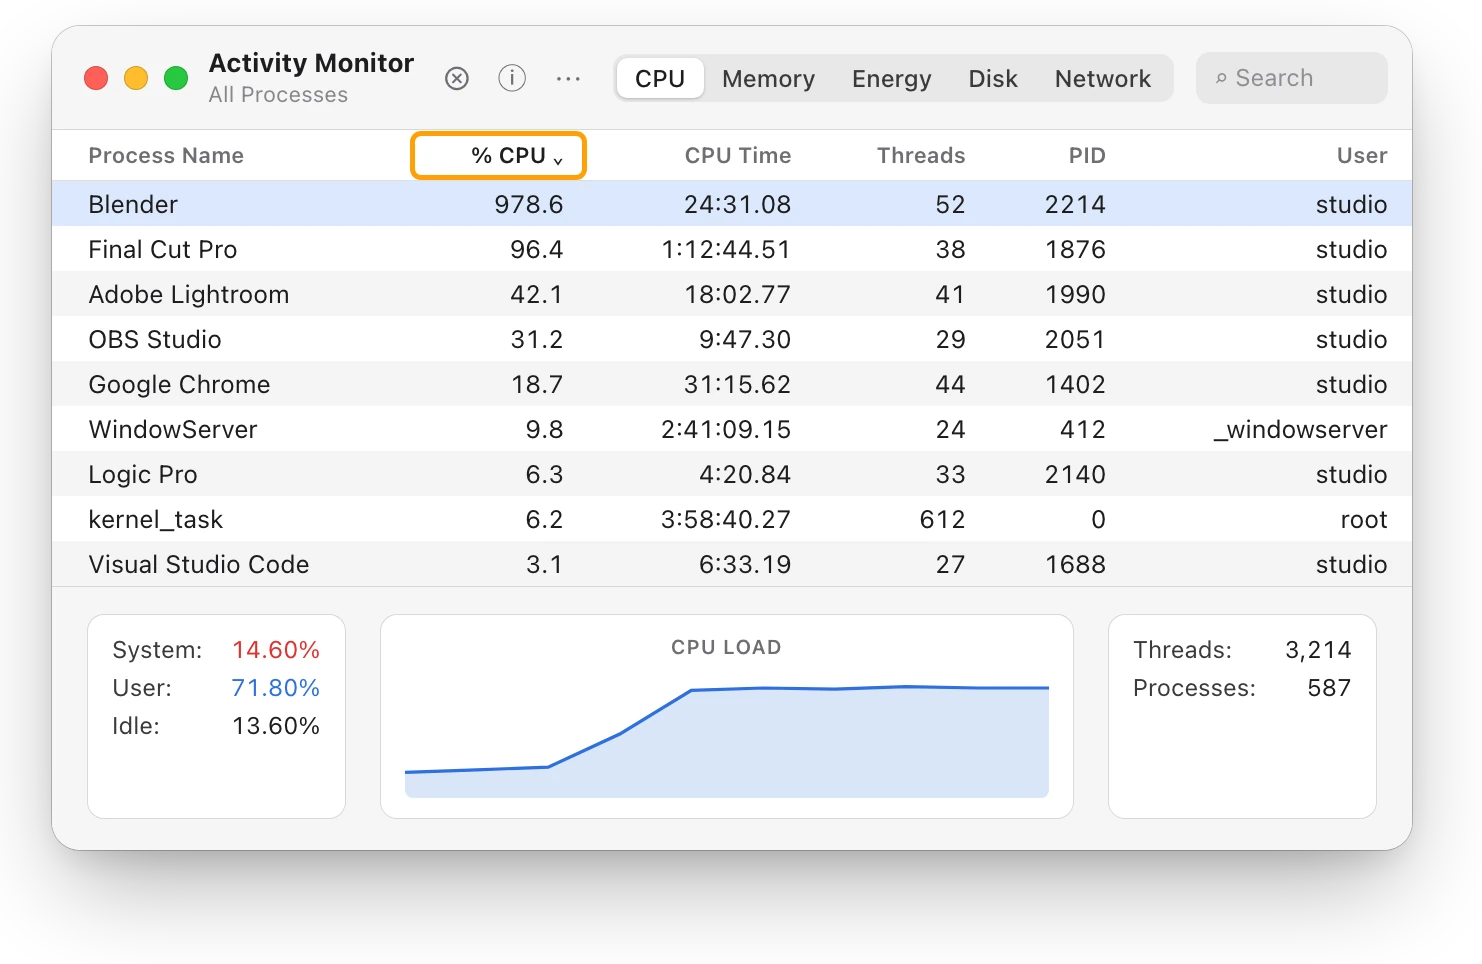
- Open Activity Monitor. It’s in Applications > Utilities, or search for it with Spotlight.
- Click CPU at the top of the window.
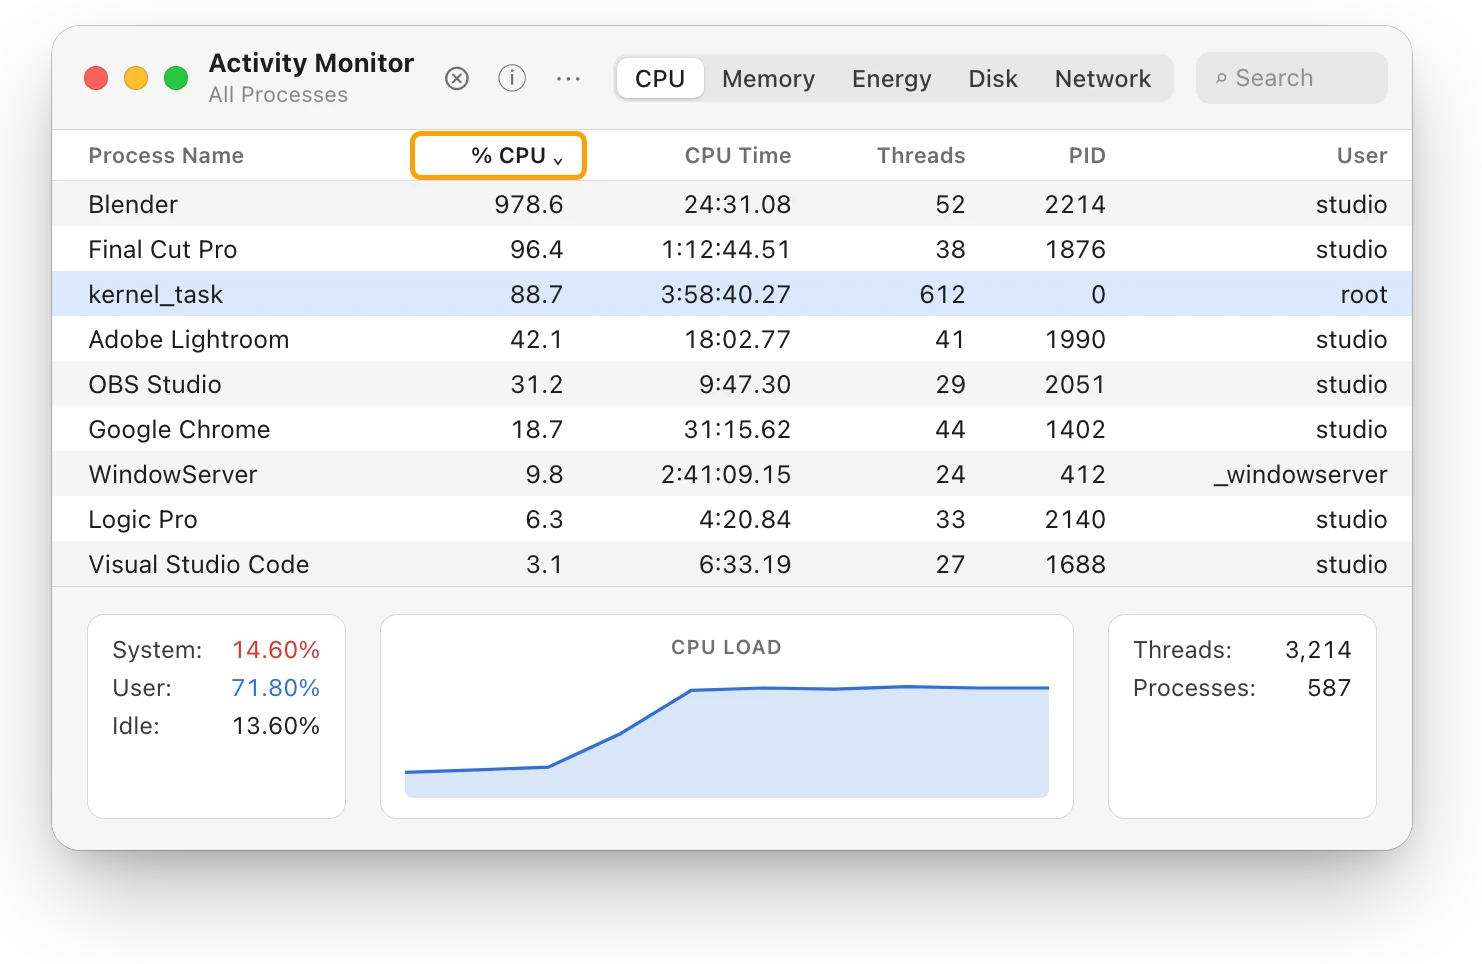
- Click the % CPU column heading to sort the list, busiest first. Click the arrow in the heading to reverse it.
- Watch the top of the list for a minute. Apps jump up for a moment when they open or save, which is normal. An app that stays near the top is doing sustained work.
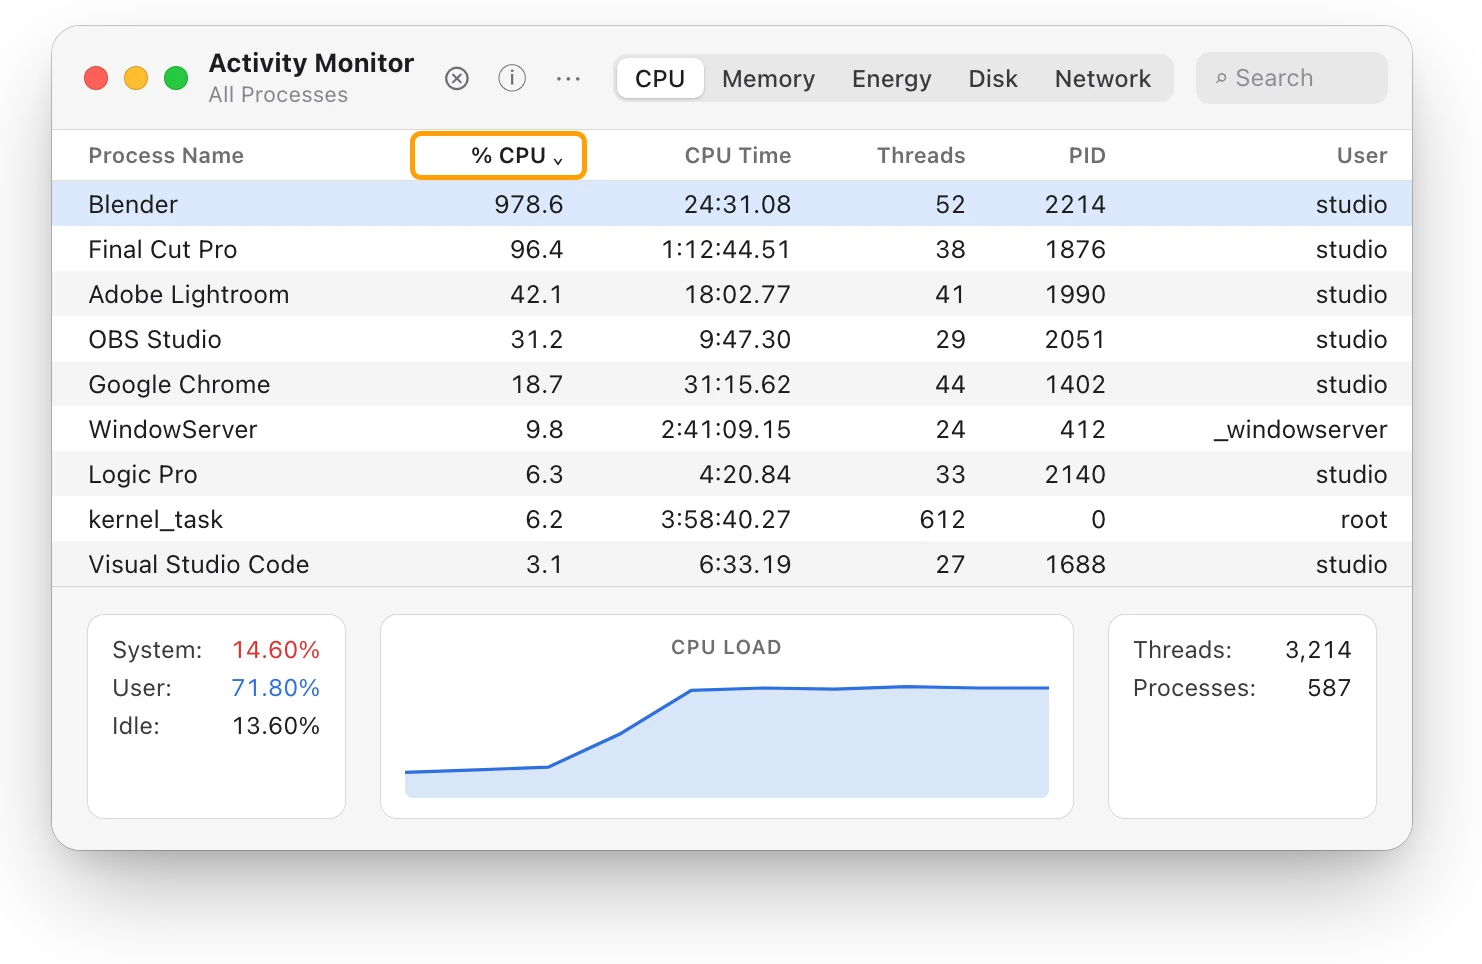
Activity Monitor counts each processor core as 100%, so an app working on several cores can show more than 100%, as Blender does here. If you’re looking for one app, type its name in the search field at the top right of the window.
How do I find the app using the most memory?
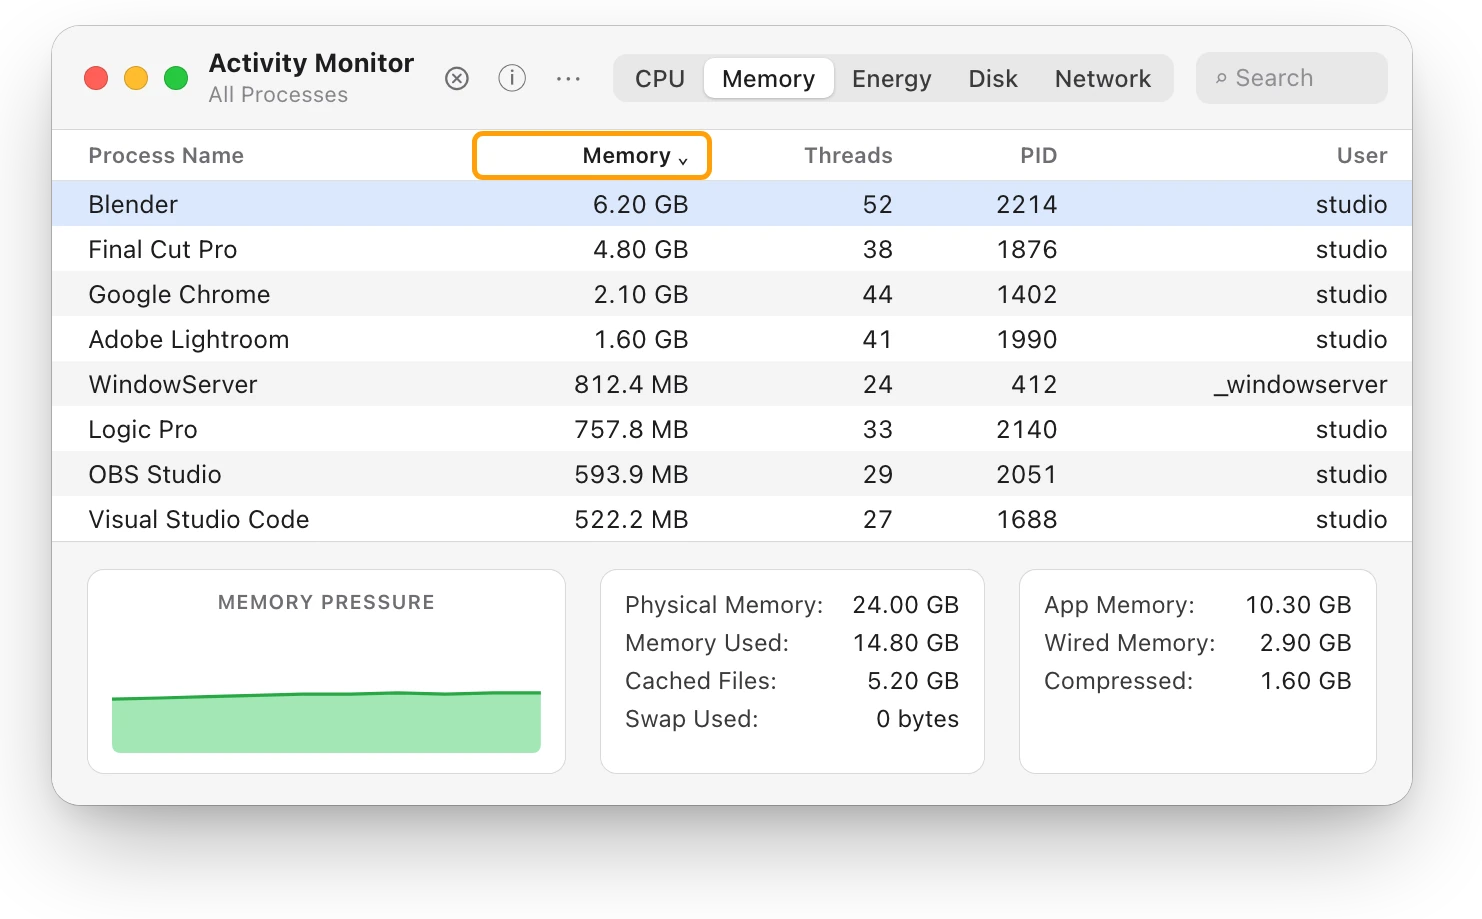
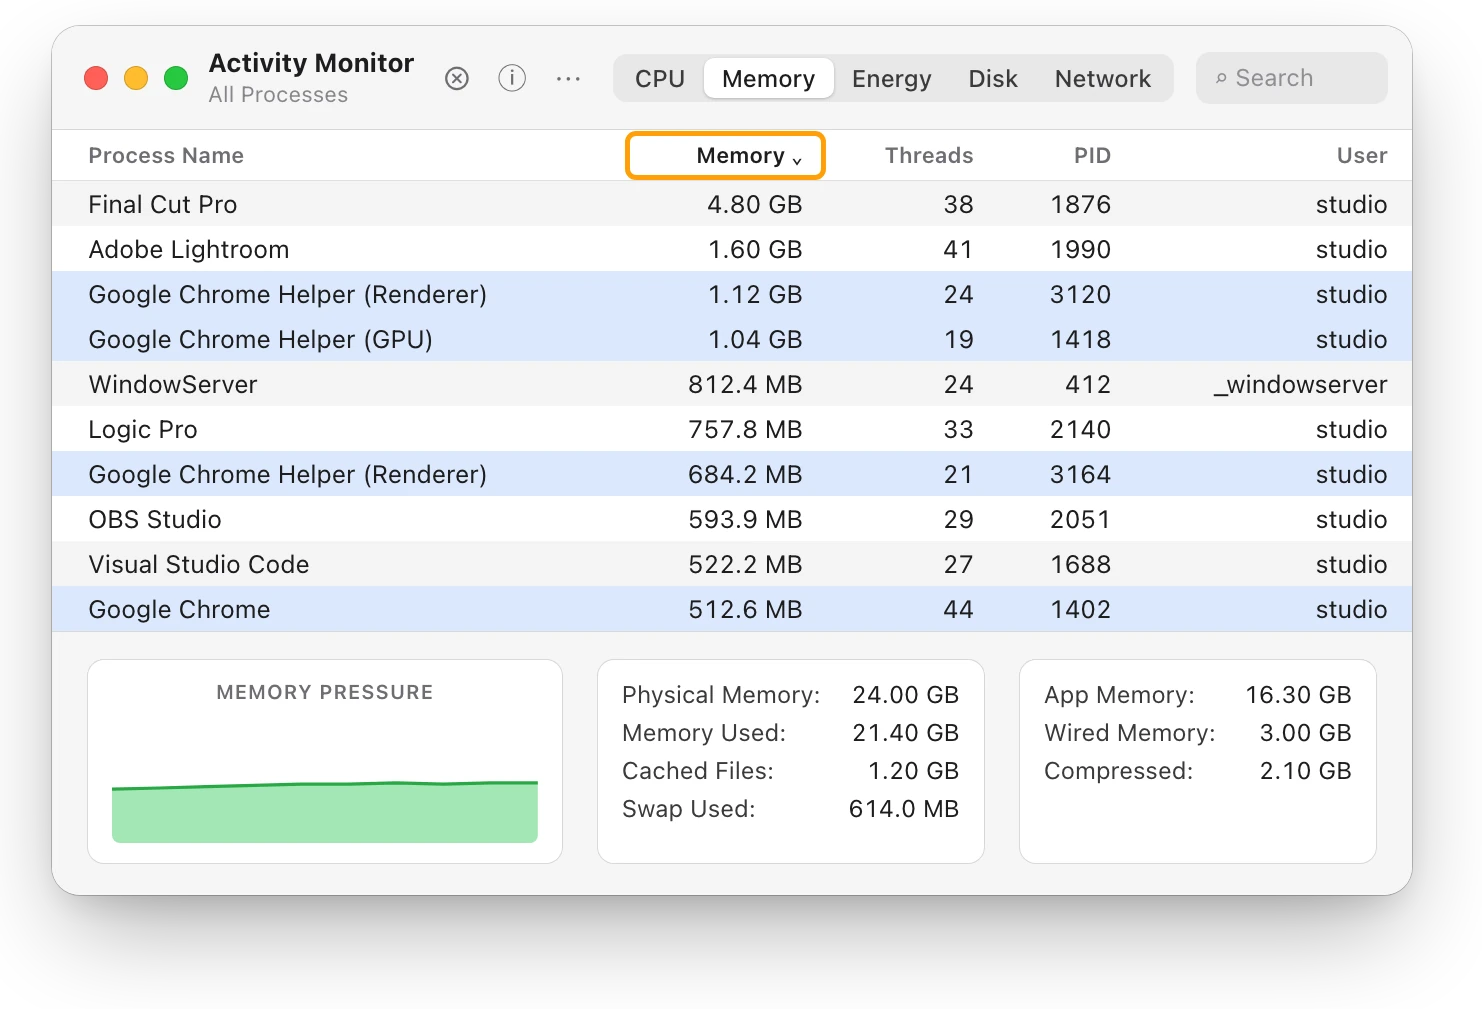
Click Memory in Activity Monitor, then click the Memory column heading to sort by it.
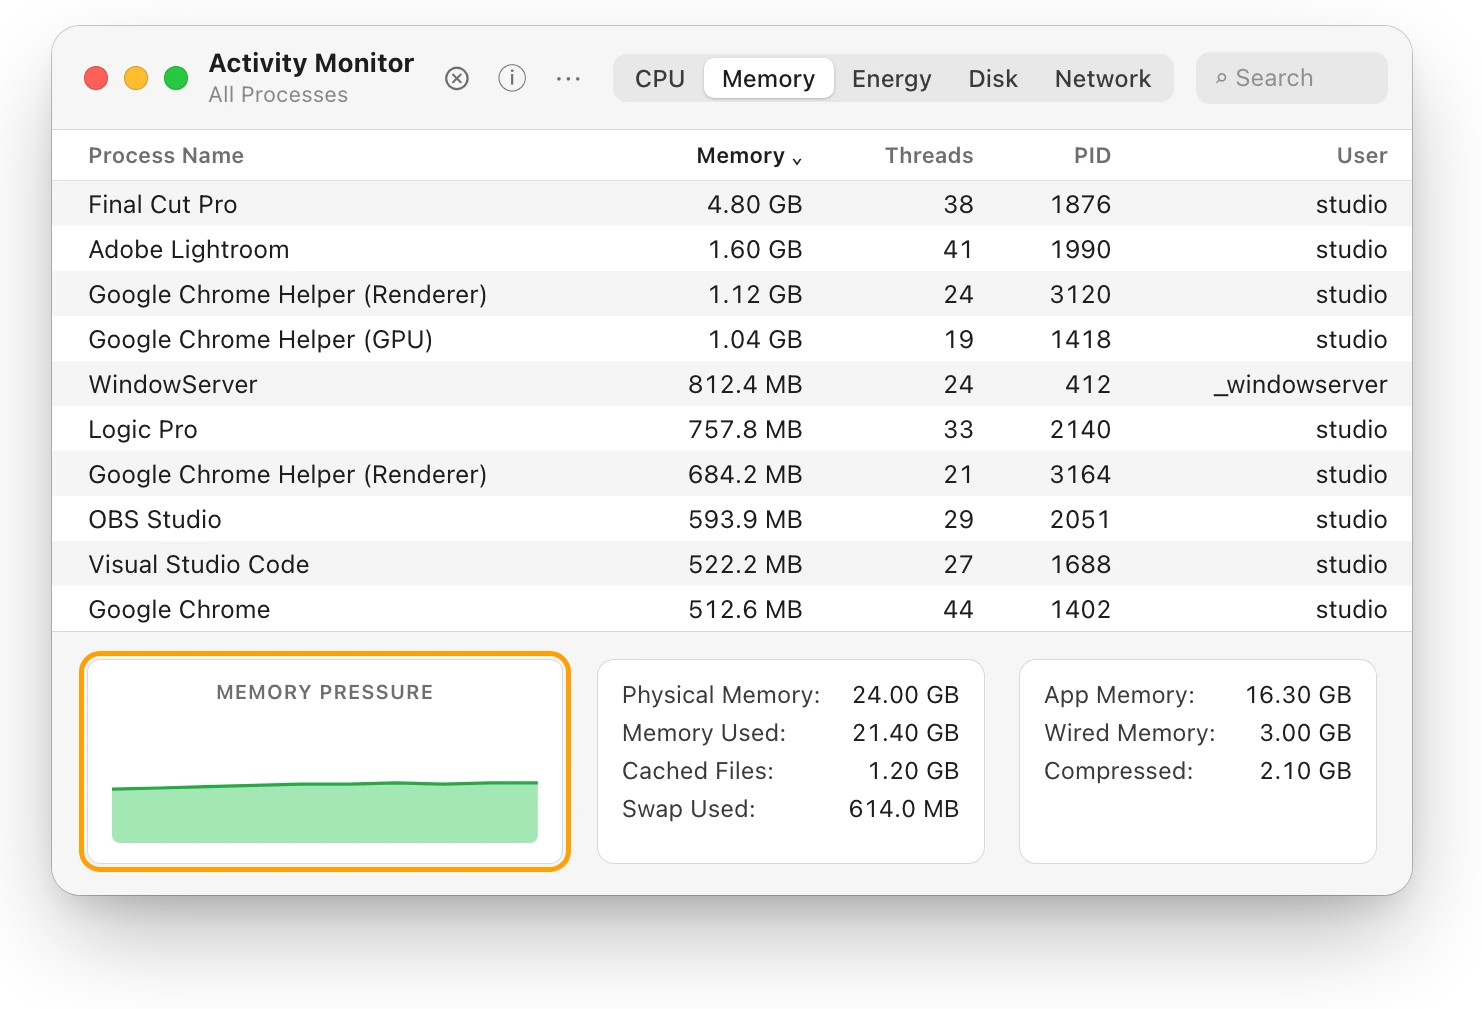
Before you quit anything, look at the Memory Pressure graph at the bottom of the window. Green means your Mac is using its memory efficiently, even if most of it is in use. Yellow or red means your Mac is short of memory, and the apps at the top of this list are the ones to close first.
Why does one app show up many times?
Many apps do their work in several processes: helpers with names such as “Helper” or “Renderer”, each in its own row. To see which app each one belongs to, choose View > All Processes, Hierarchically. Activity Monitor then shows each process under the one that started it.
What should I do about the app?
- If it’s doing work you asked for, such as an export, a render or a large download, let it finish. It eases off on its own.
- If you don’t need it right now, quit it from its own menu. Save your work in it first.
- If it isn’t responding, select it in Activity Monitor, click the Stop button at the top of the window, and choose Quit. Choose Force Quit only if Quit doesn’t work, because anything unsaved in that app is lost.
- If it happens every day, check whether the app opens at login: Apple menu > System Settings > General > Login Items & Extensions.
What if no app stands out?
When no app stays at the top, the slowdown is usually somewhere else: a startup disk that’s nearly full, a Mac that’s too hot, or memory pressure that stays yellow or red with many apps open. Why is my Mac slow? walks through each one.
Questions people also ask
Why is kernel_task using so much CPU?
kernel_task is part of macOS, not an app. Apple says one of its jobs is to keep the processor from getting too hot, by making it less available to processes using it heavily. Look for the app working hard, and give your Mac room for air.
Is it safe to quit an app from Activity Monitor?
Quit is as safe as quitting from the app’s own menu. Force Quit closes the app at once, so any work you haven’t saved in it is lost.
Why is my Mac slow when nothing is open?
Something may be running without a window, such as an app that opens at login or a sync in the background. In Activity Monitor, sort by % CPU to see it, and check Login Items & Extensions in System Settings.
Scope for Mac · Free, coming to the Mac App Store
How Scope helps
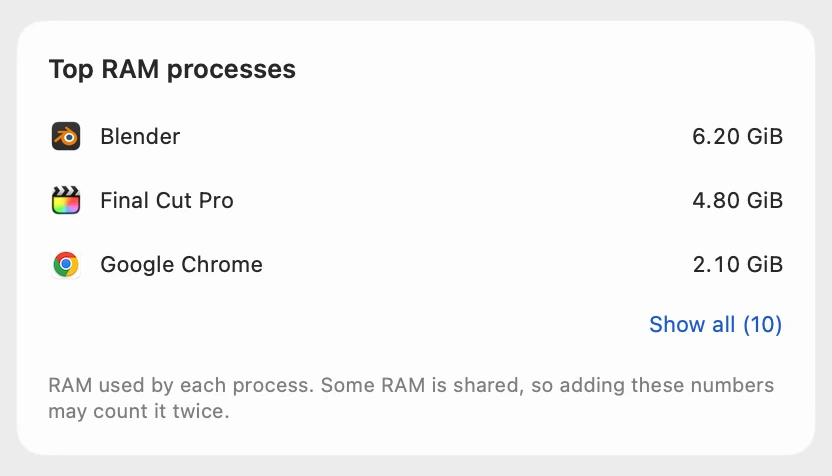
Scope is a free Mac menu bar app that shows which apps are using the most CPU and memory, without opening Activity Monitor. Each process shows the icon of the app it belongs to, and Scope Pro names the app behind a lasting problem, its helper processes counted together.
In your menu bar
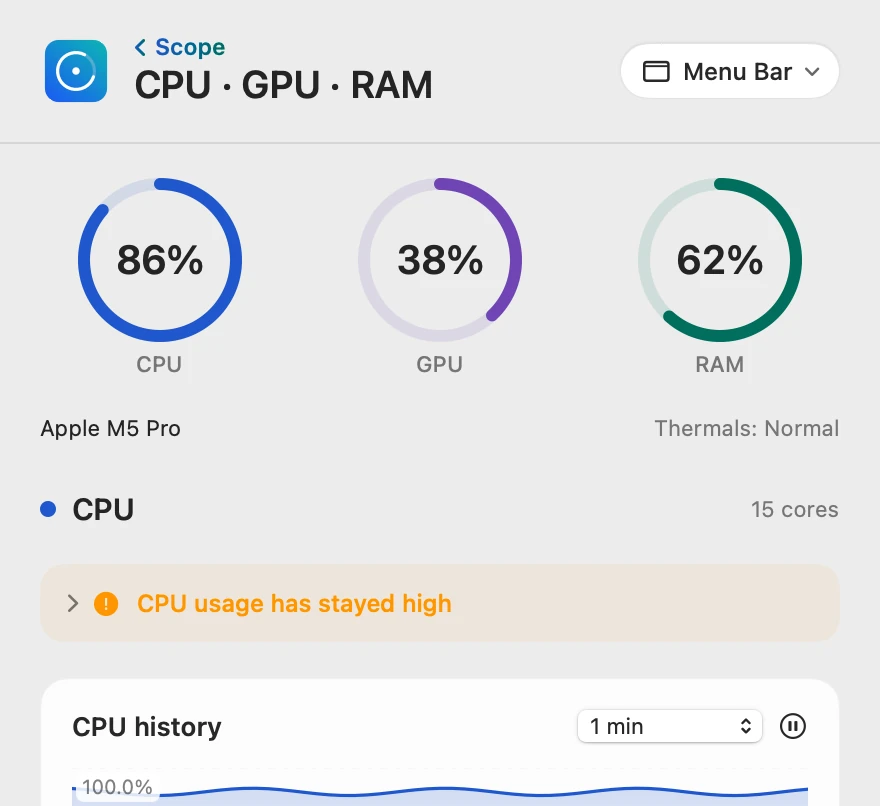
A busy processor shows in the menu bar, and one click opens the apps behind it.

Both lists, side by side
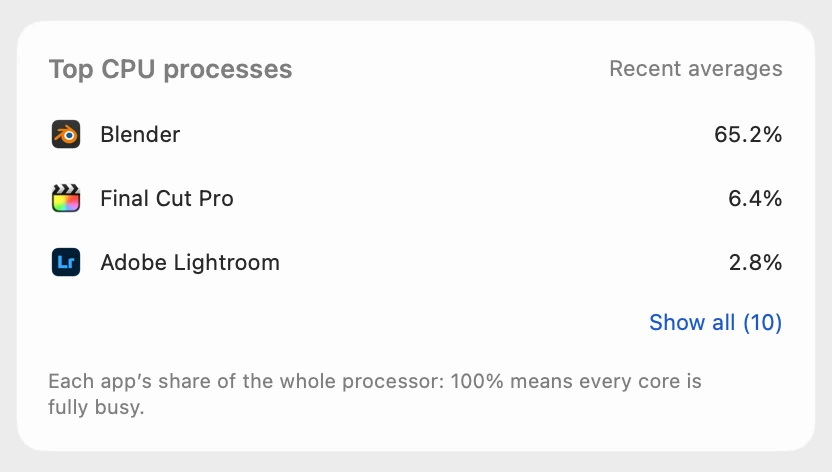
Scope shows each app’s share of the whole processor, so 100% means every core is busy. This Mac has 15 cores, so Blender’s 978.6% in Activity Monitor is 978.6 ÷ 15 = 65.2% here. Click a process in Scope to see more, or to open Activity Monitor.
Named when it lasts
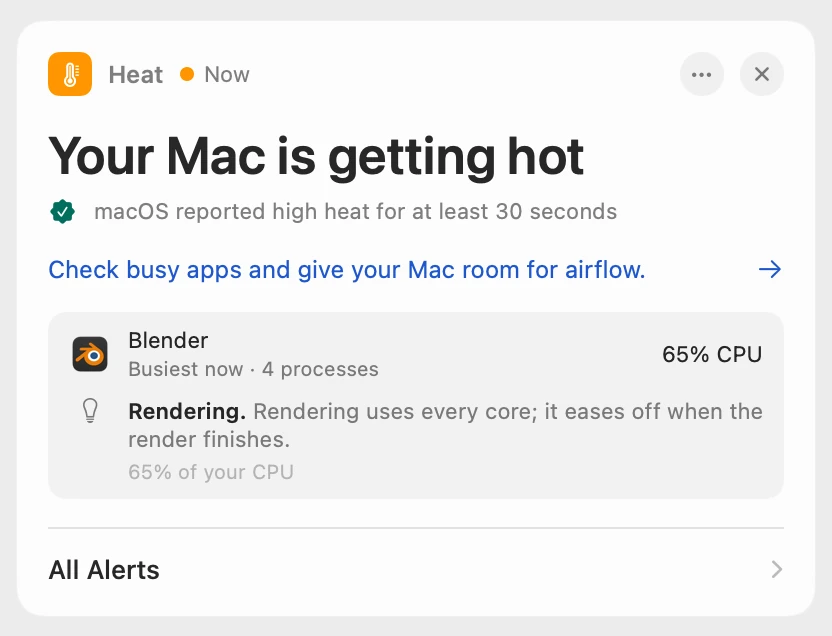
Scope waits until a problem has lasted, so a passing spike never raises an alert. Scope Free shows the alert when you open Scope. Scope Pro adds a red + on its menu bar icon and names the app behind the problem, its helper processes counted with it (“4 processes”), and a tip about what it’s doing.
Scope shows and explains. It never quits apps for you, so what to close stays your call.
Try it here
The real Scope, working, right in this page.
Click any item in the menu bar, or a card inside, as you would on your Mac.
Scope Pro Every menu bar item is shown here. Scope Free keeps one whole item of your choice, with every reading inside.
See which app it is on your own Mac.
Keep reading
Guide · Slow Mac
Why is my Mac slow? How to find the cause
A slow Mac is usually a busy app, too little memory, a nearly full disk or heat. Here’s how to see which one with macOS’s own tools.
Slow Mac
Why is my Mac suddenly slow?
A Mac that turns slow all of a sudden usually has something new keeping it busy. Activity Monitor shows what started; here’s how to find it.
Slow Mac
Mac memory pressure: why high RAM use is often fine
Memory pressure, not RAM in use, shows if your Mac has enough memory. Green is fine even when RAM is nearly full; yellow or red means it’s running short.
Slow Mac
Why is Chrome using so much memory on a Mac?
Chrome runs tabs and parts of the browser as separate processes, so its memory adds up. Here’s how to see it on a Mac, and when it matters.
Heat
kernel_task high CPU? Your Mac is cooling itself
High kernel_task CPU means your Mac is too hot: macOS holds the processor back while it cools. Find the app making the heat, and give your Mac air.
Sources
- Apple Support: View information about Mac processes in Activity Monitor
- Apple Support: Check if your Mac needs more RAM in Activity Monitor
- Apple Support: Quit a process in Activity Monitor on Mac
- Apple Support: If kernel_task is using a large percentage of your Mac CPU
- Apple Support: Open items automatically when you log in on Mac
Last checked October 17, 2026. Readings, apps and files in the pictures are from a made-up Mac.