Scope for Mac
Mac CPU, GPU and RAM monitor for your menu bar
Scope is a free Mac menu bar app that shows how busy your Mac’s processor, graphics and memory are, as three live percentages. One click shows which apps use the most CPU and RAM, the heat level macOS reports, and what the last few minutes looked like. It works on Mac computers with Apple silicon or Intel processors running macOS 13 or later.
Free, coming to the Mac App Store. Scope Pro is a one-time purchase.
In your menu bar
The item shows CPU, GPU and RAM as live percentages, side by side (Horizontal) or stacked (Vertical), with one, two or all three. Scope Free keeps one whole menu bar item of your choice, and CPU · GPU · RAM is the one it starts with.

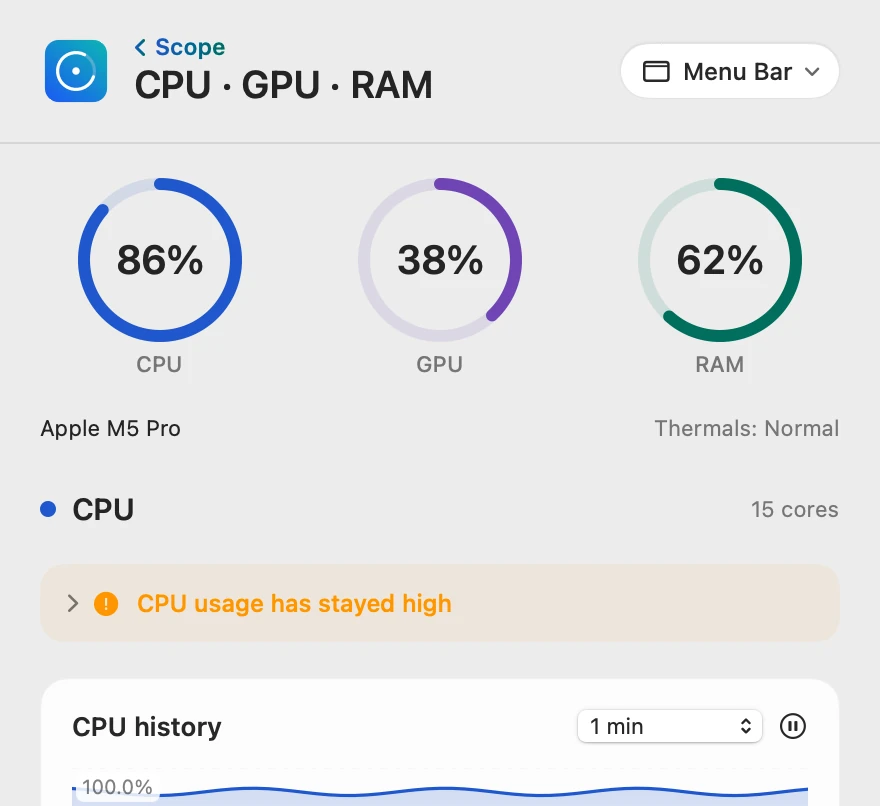
Three rings, one glance
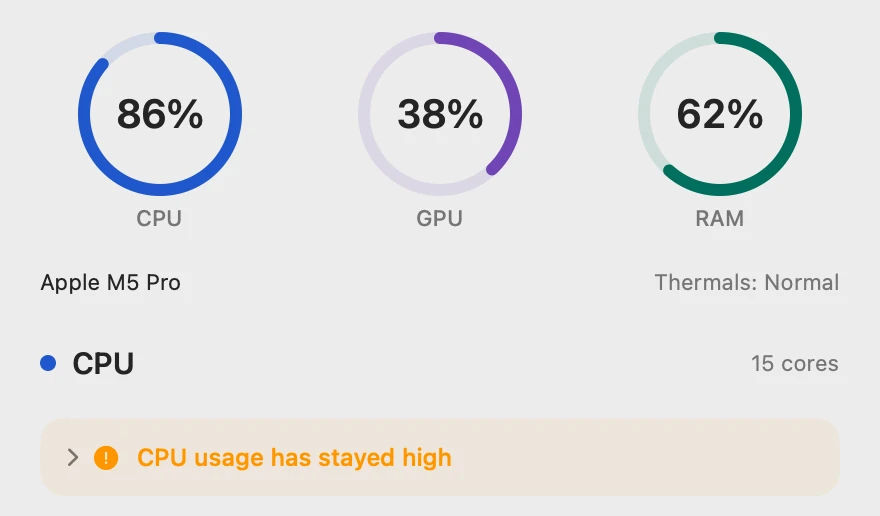
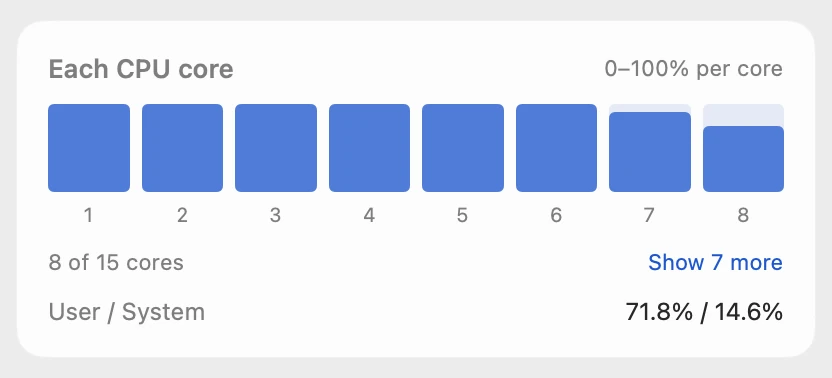
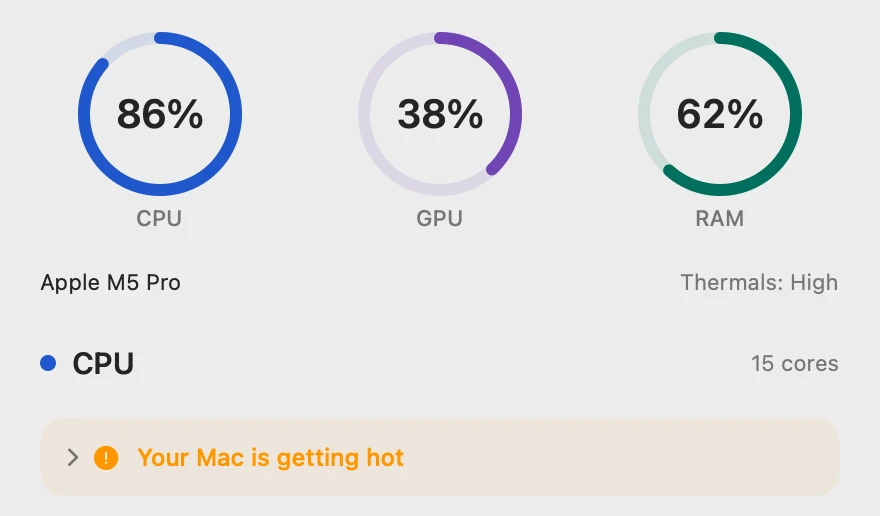
CPU is the share of the whole processor in use, so 100% means every core is fully busy. GPU is how busy the graphics are, and RAM is the share of memory in use. Under the rings, a tip says what the reading means right now, and Each CPU core shows every core on its own, eight at a time.
Which app is busy
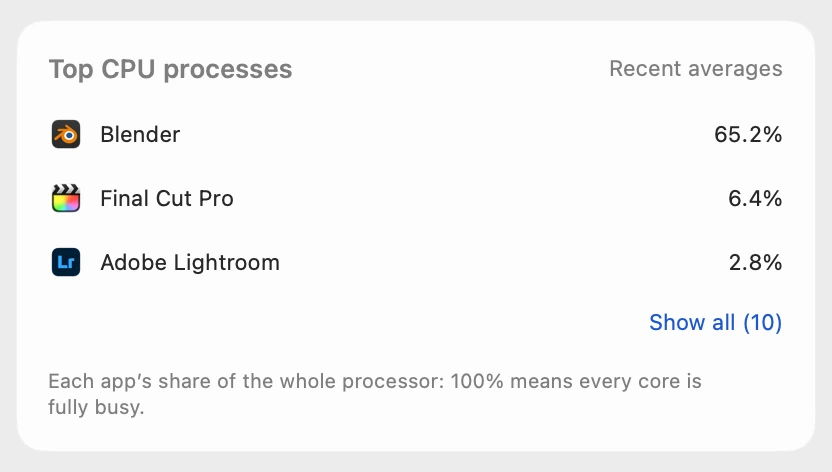
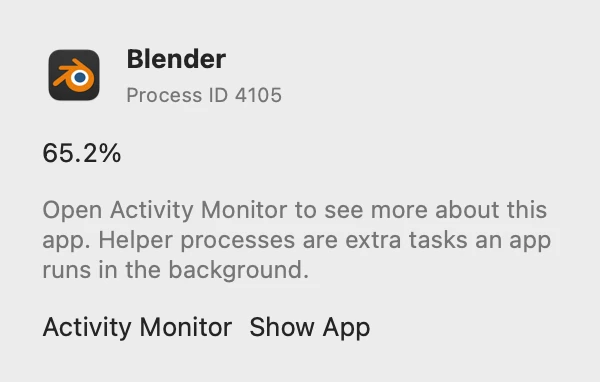
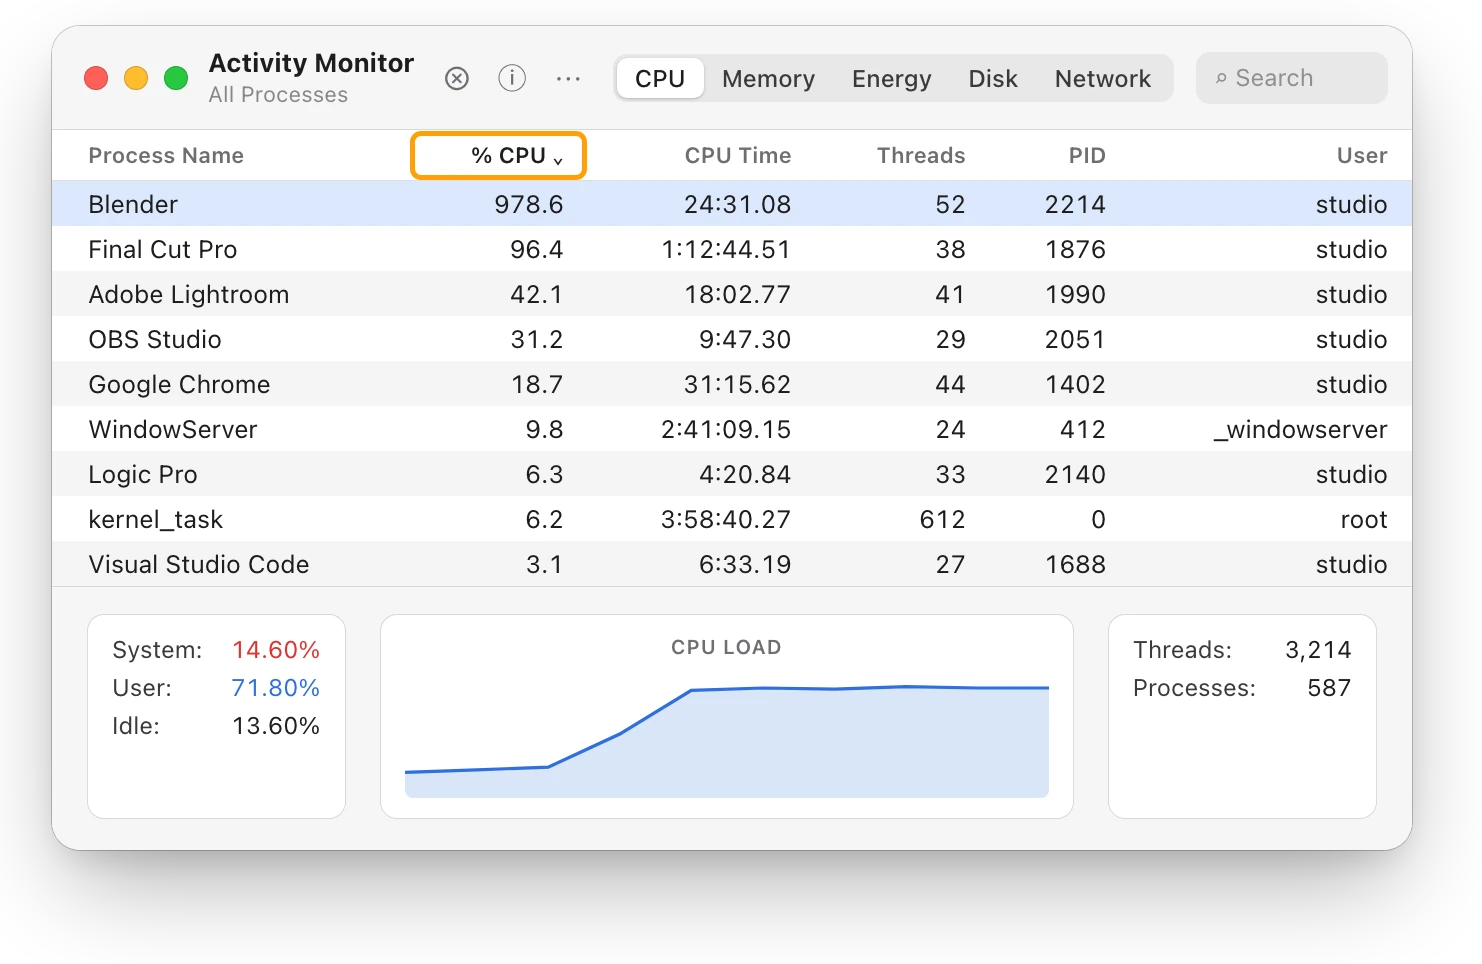
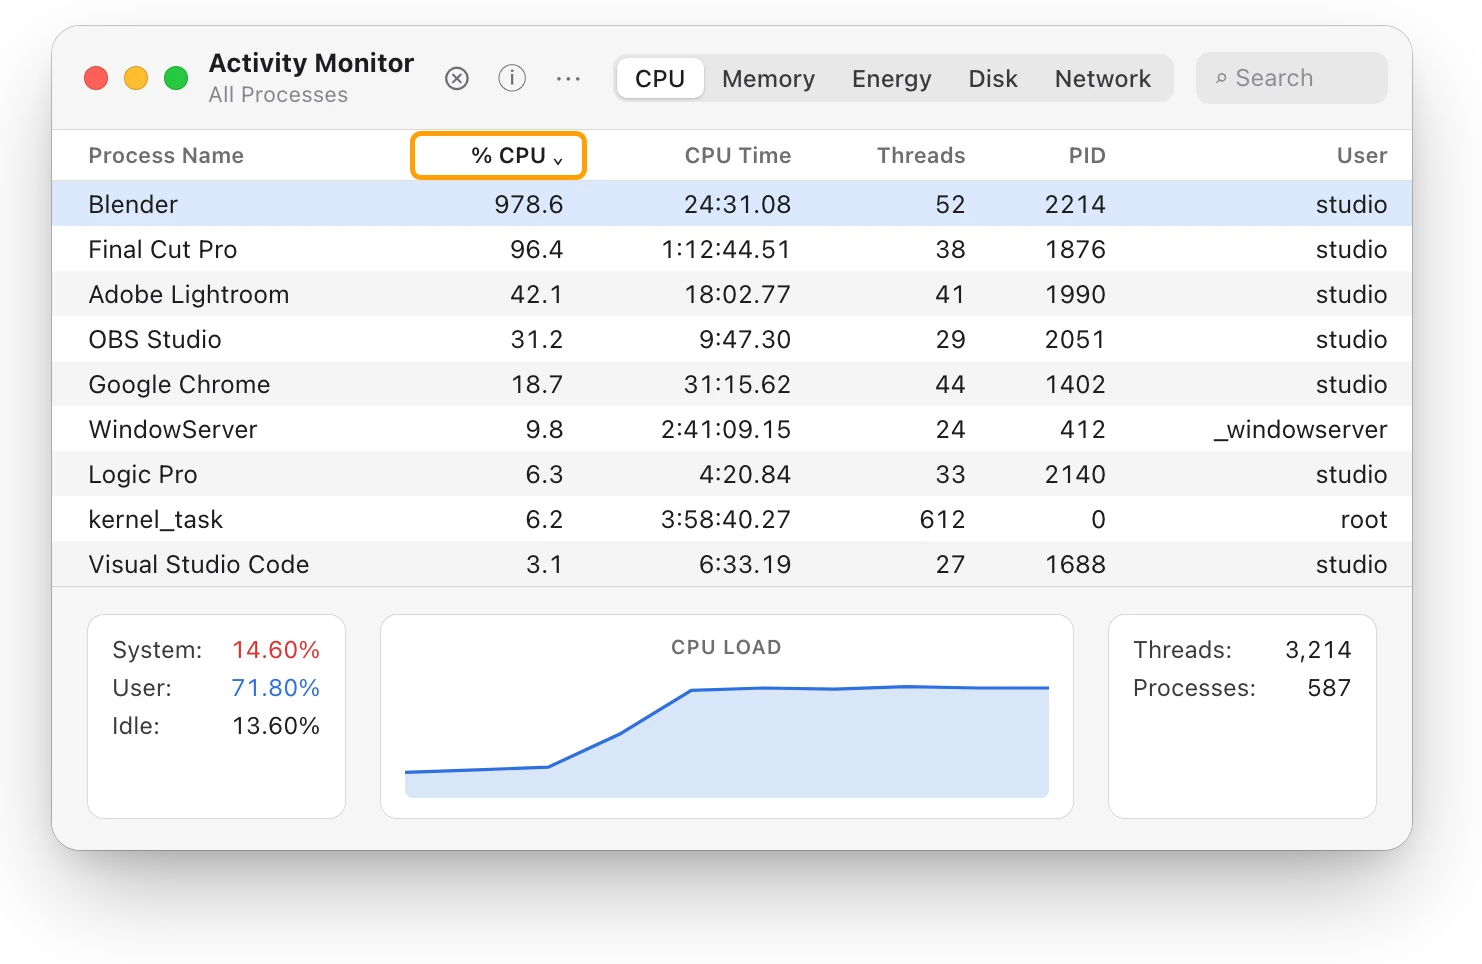
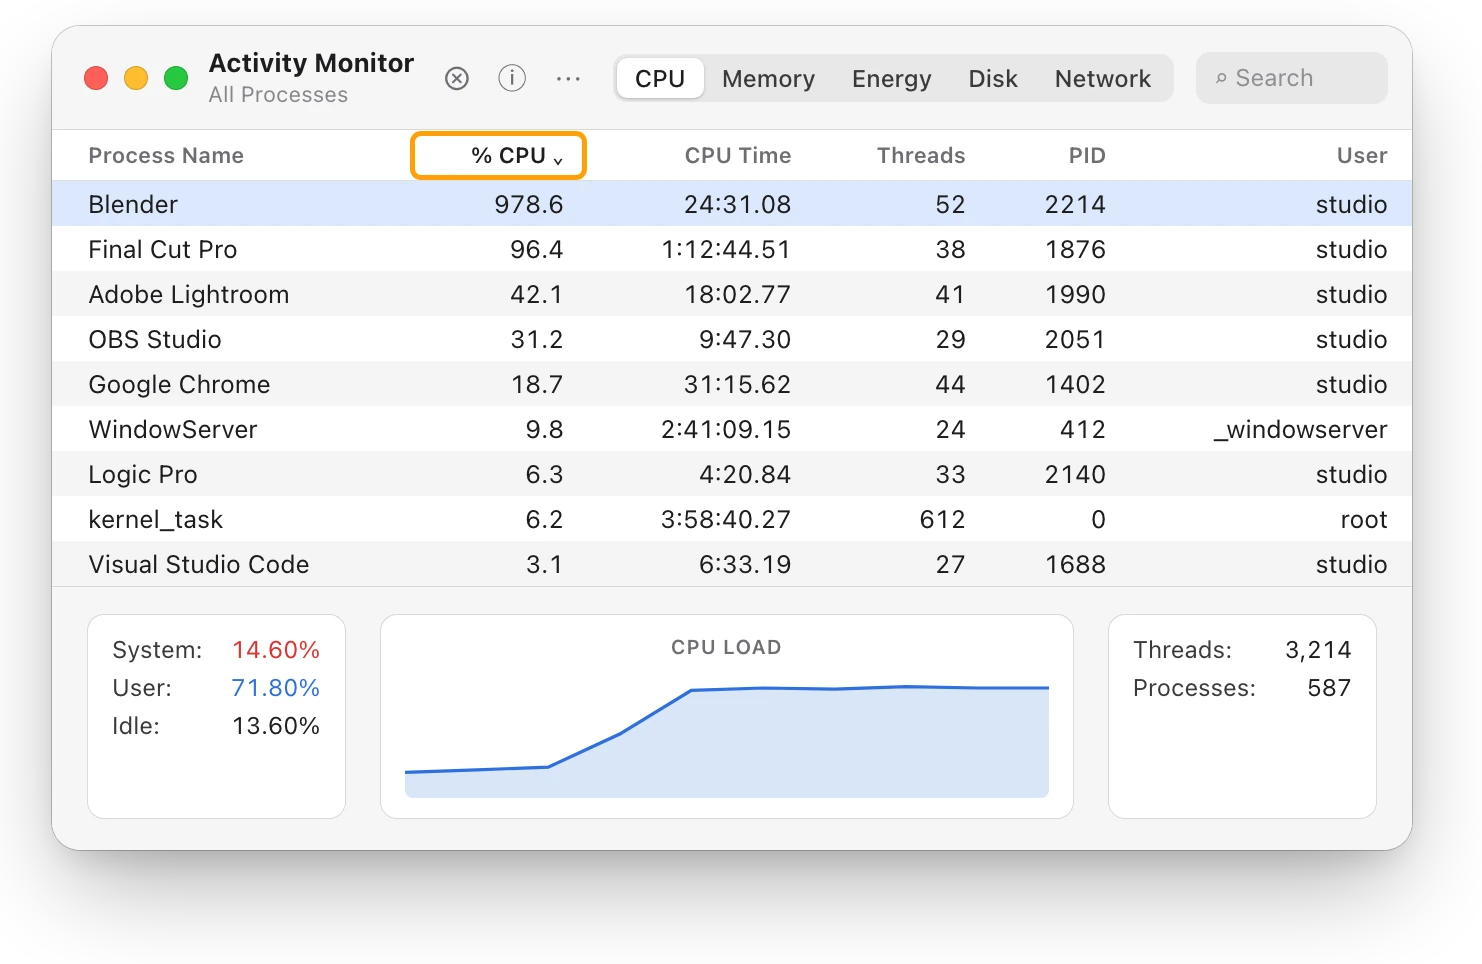
Top CPU processes lists the apps you run, each process on its own row with its app’s icon, and Show all opens the rest. Activity Monitor counts each core as 100%, so it shows Blender at 978.6%; on this 15-core Mac that’s 978.6 ÷ 15 = 65.2%. Click a process to see its details, with buttons that open Activity Monitor or show the app.
Heat, as macOS reports it
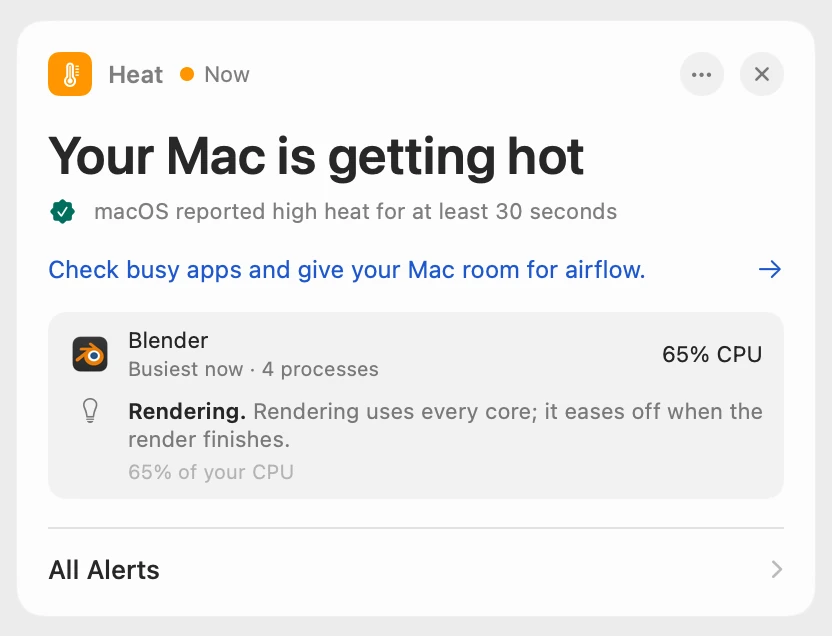
Thermals, beside the chip’s name, is the heat level macOS reports: Normal, Warm, High or Critical. It’s a level, not degrees. Scope shows no CPU or GPU temperatures and no fan speeds. At High or Critical, the tip “Your Mac is getting hot” suggests checking the busiest apps and making sure air can flow around your Mac.
The last ten minutes
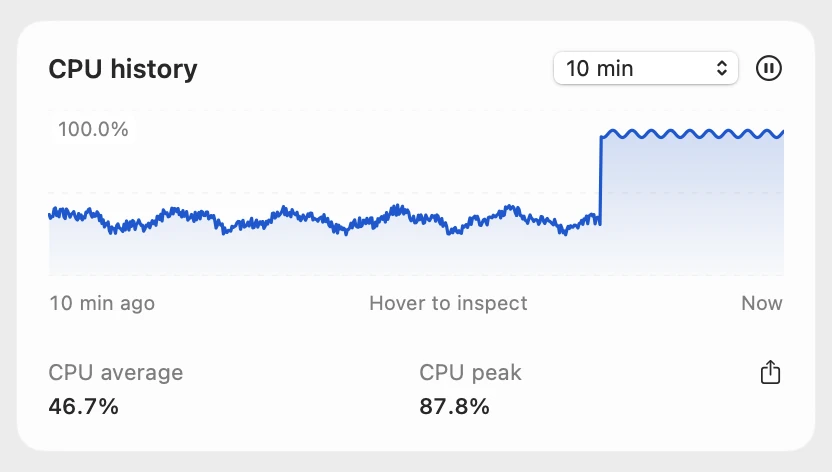
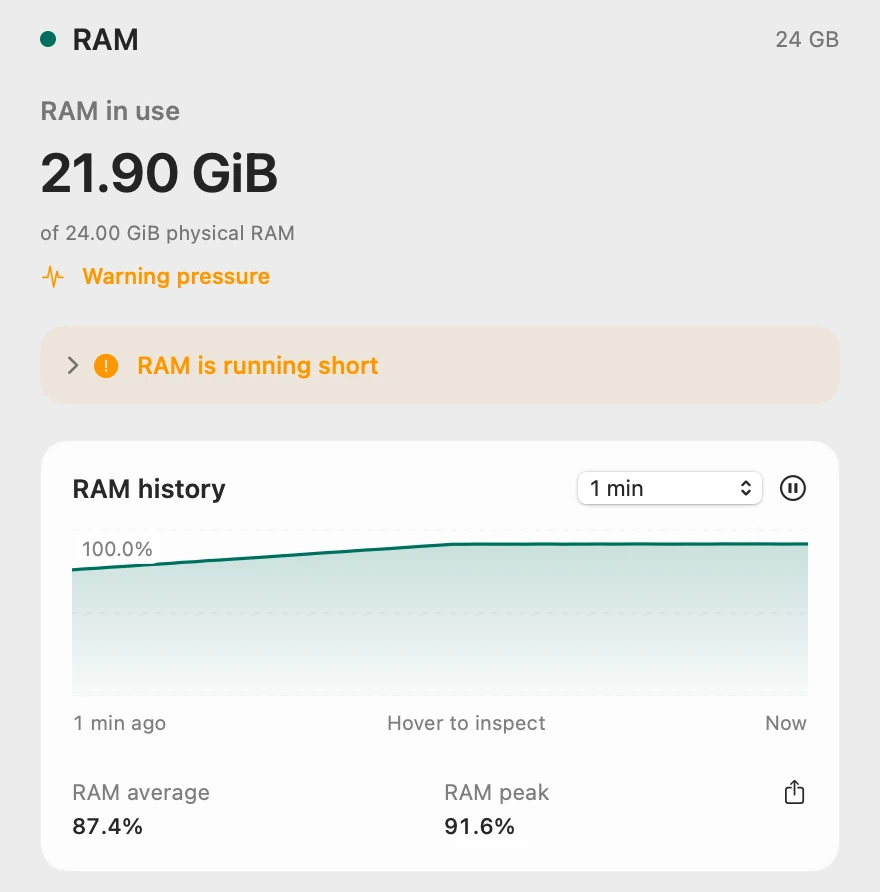
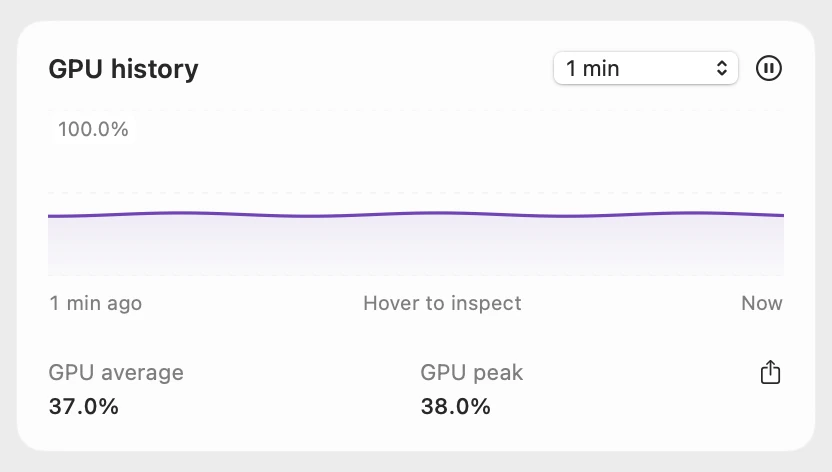
CPU, GPU and RAM each have a history chart. Scope Free shows the last 1, 5 or 10 minutes. Hover to read any moment, or pause a chart to look closely while the menu bar keeps updating.
A day of CPU
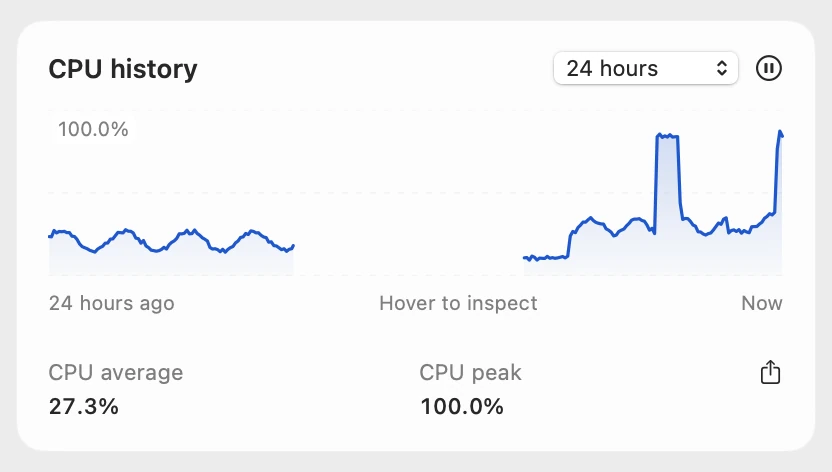
Scope Pro charts 1, 6 or 24 hours, and the record survives restarts. Over these windows the peak is the highest minute, and the line breaks where Scope wasn’t running or the Mac slept. Scope Pro also exports any chart as a CSV file.
Where your RAM goes
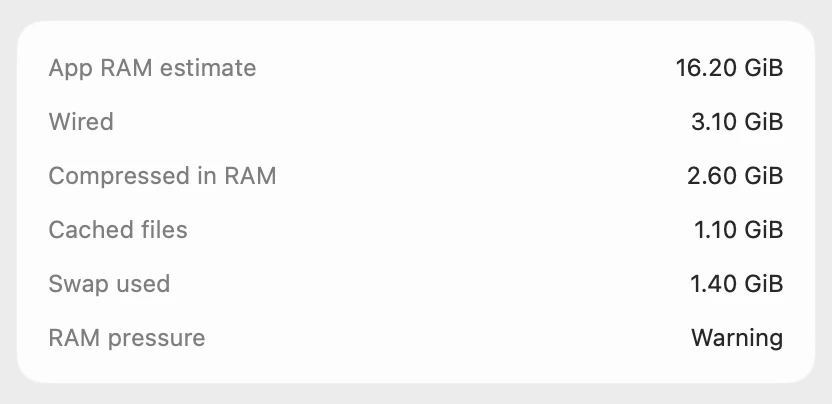
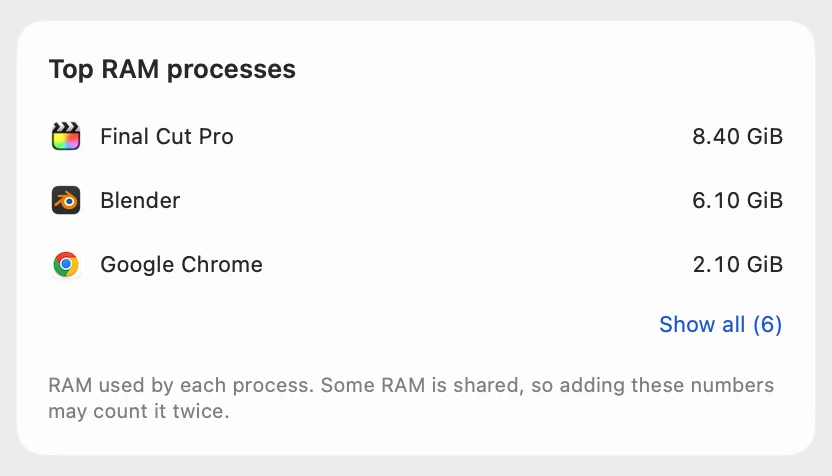
RAM pressure says whether your Mac has room to work, and it tells you more than how full RAM looks. App RAM estimate is an estimate of what apps use. Wired is memory that has to stay in RAM, much of it macOS’s own. Compressed in RAM is memory squeezed to make room. Cached files is memory macOS can hand to an app that needs it. Swap used is memory written to the startup disk. Top RAM processes shows which apps hold the most.
The GPU, in detail
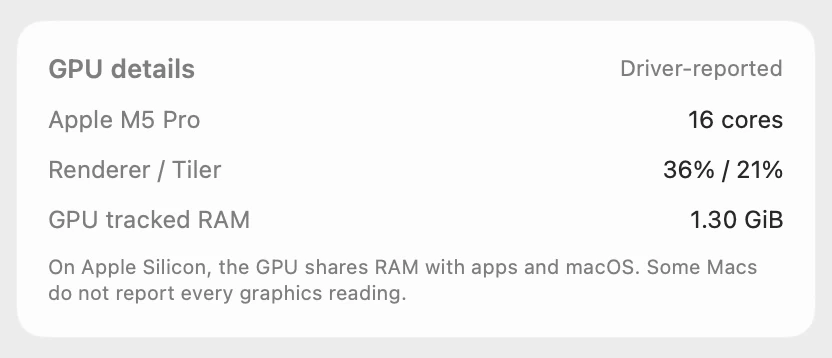
GPU details show the graphics’ cores, how busy the renderer and tiler are, and the memory the graphics driver tracks. On Apple silicon the GPU shares RAM with apps and macOS, so that memory is part of RAM, not a separate pool. Some Macs don’t report every graphics reading.
Alerts that name the app
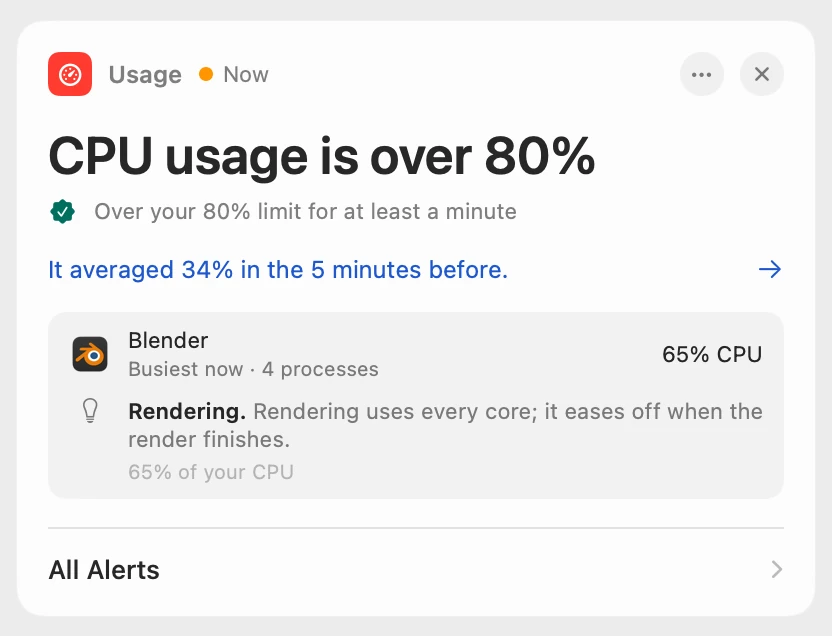
With Scope Pro, a problem that lasts puts a red + on Scope’s menu bar icon, sends a macOS notification and names the app behind it, with a tip. CPU and GPU usage alerts start off; turn them on and set your own limits, 80% to start. Heat, RAM pressure and RAM in use alerts also show in Scope Free, on the overview when you open Scope, without the app’s name.
Scope Free and Scope Pro
| Scope Free shows | Scope Pro adds |
|---|---|
| CPU, GPU and RAM, Thermals, the tips, each CPU core, GPU and RAM details, Top CPU and Top RAM processes | The same readings: nothing is held back |
| CPU · GPU · RAM as your one menu bar item, with any metrics, Horizontal or Vertical | Every Scope item at once, and usage highlights: a reading past its limit turns red |
| History for the last 1, 5 and 10 minutes | 1, 6 and 24 hours, kept across restarts, with CSV export |
| Heat, RAM pressure and RAM in use alerts on the overview when you open Scope | The red + on the menu bar icon, a notification, the app behind it with a tip, CPU and GPU usage alerts at your own limits, and the week of alerts |
Questions people also ask
Does Scope show CPU temperature?
No. Scope shows the heat level macOS reports, Normal, Warm, High or Critical, and the battery’s own temperature in its Battery panel. It shows no CPU or GPU degrees and no fan speeds.
Why does Scope show 65% when Activity Monitor shows 978%?
They count differently. Activity Monitor counts each core as 100%, so a 15-core Mac can reach 1,500%. Scope shows each app’s share of the whole processor, from 0 to 100%.
Does Scope list kernel_task and WindowServer?
No. Scope’s lists show the apps and processes you run; macOS’s own background processes run in other accounts, so Activity Monitor is the place to see them. Their work still counts in Scope’s CPU total.
Does Scope slow my Mac down?
In Scope’s own tests, with only the menu bar showing, Scope uses about 1–2% of one CPU core. An open panel uses about 4–7% of one core while it updates every second.
Can Scope free up RAM or quit apps?
No. Scope shows and explains; it never quits apps, frees memory or changes settings. Top RAM processes shows which apps hold the most, and what to close stays your call.
Is Scope free?
Yes. Scope Free shows every reading on this page, with one whole menu bar item of your choice. Scope Pro is a one-time purchase that adds more menu bar items, highlights, alerts with their cause and 24 hours of history.
Try it here
The real Scope, working, right in this page.
Click any item in the menu bar, or a card inside, as you would on your Mac.
Scope Pro Every menu bar item is shown here. Scope Free keeps one whole item of your choice, with every reading inside.
See CPU, GPU and RAM on your own Mac.
Guides for this
Slow Mac
How to check CPU usage on a Mac
Check CPU usage on a Mac in Activity Monitor’s CPU tab. Here’s what % CPU, System, User and Idle mean, why a process can pass 100%, and other ways to look.
Slow Mac
Which app is slowing down my Mac? How to find it
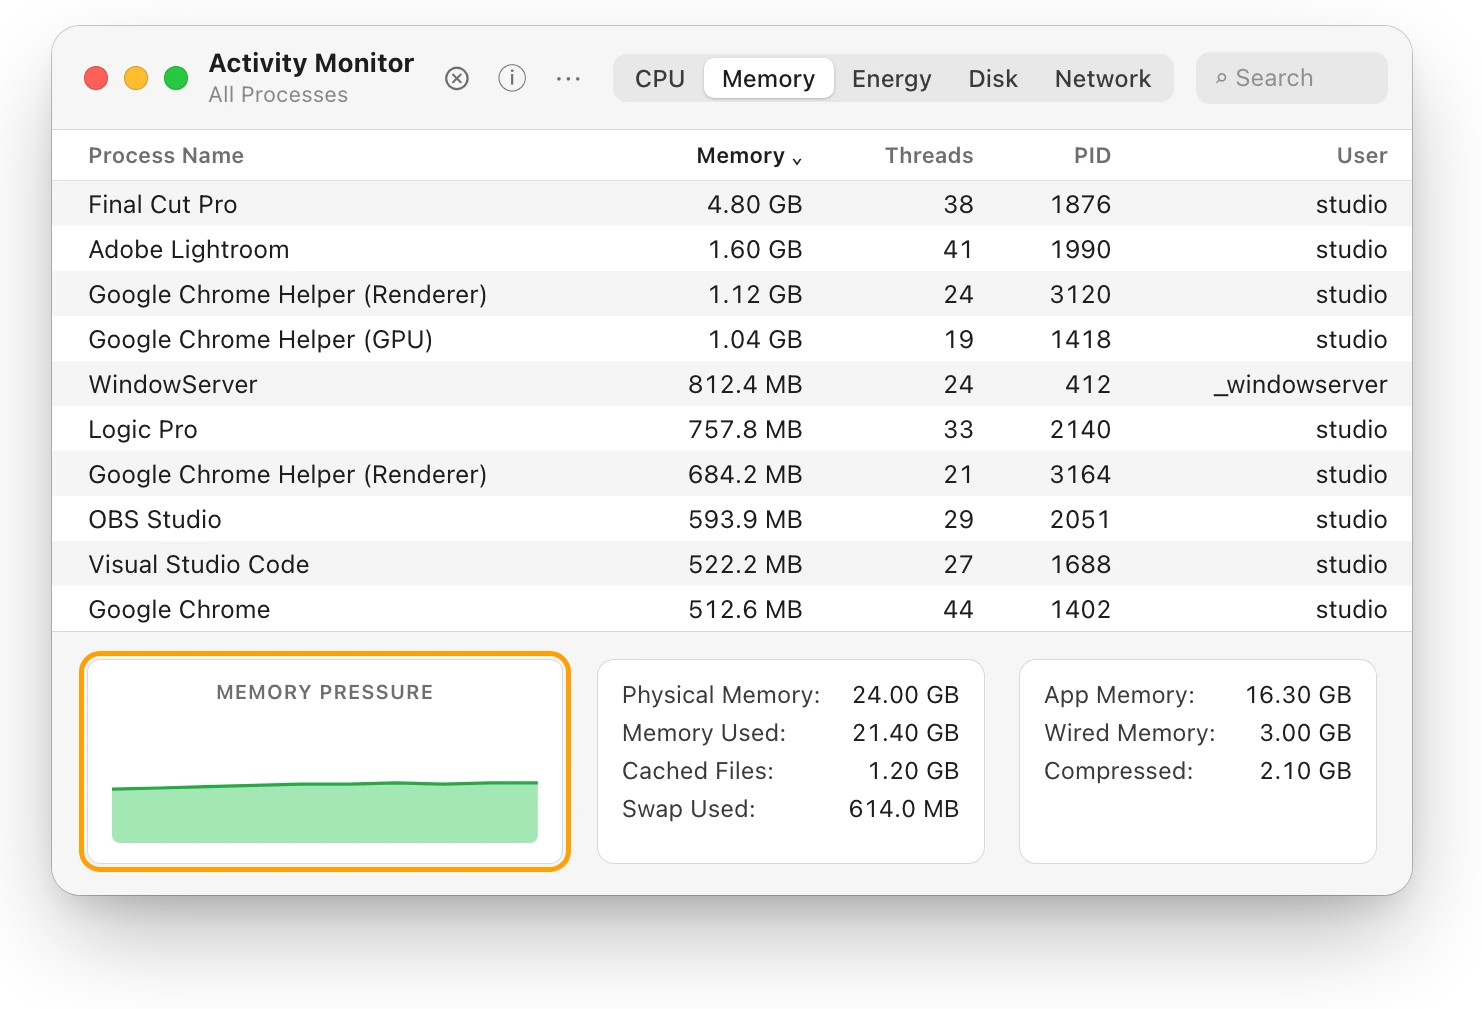
Activity Monitor shows which app is slowing your Mac: sort by % CPU, then by Memory. Here’s how to read the lists, and what to do next.
Slow Mac
Mac memory pressure: why high RAM use is often fine
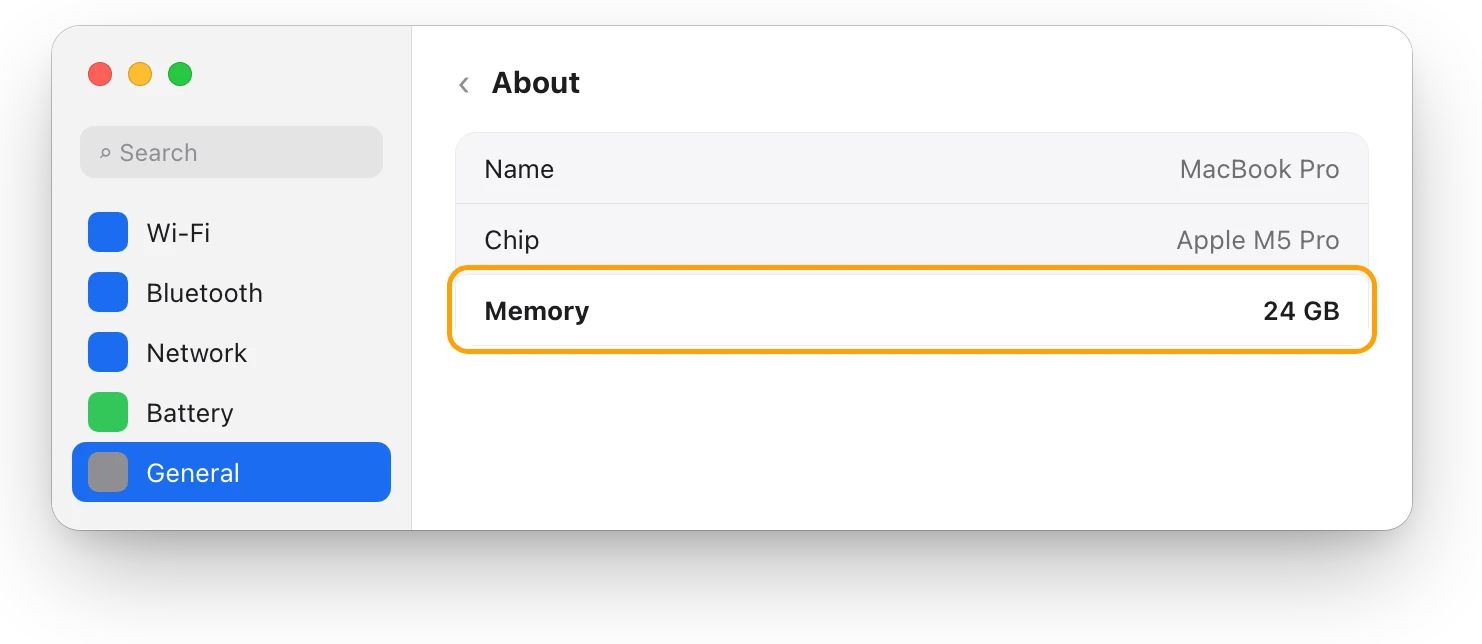
Memory pressure, not RAM in use, shows if your Mac has enough memory. Green is fine even when RAM is nearly full; yellow or red means it’s running short.
Slow Mac
Is 8 GB or 16 GB of RAM enough for your Mac?
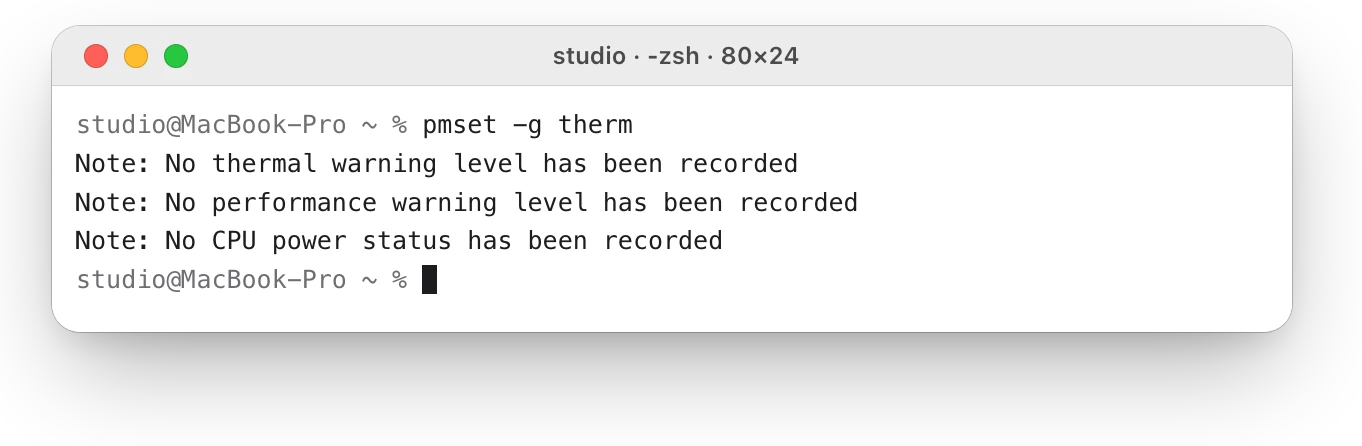
Memory pressure tells you if your Mac has enough RAM: green on your busiest day means it does. Here’s how to check, and what to buy next.
Heat
How to check your Mac’s CPU temperature
macOS doesn’t show your Mac’s CPU temperature in degrees. It reports a heat level instead. Here’s how to check it, and what Apple says is normal.
Your Mac
Activity Monitor on a Mac: every tab explained
What each Activity Monitor tab shows on a Mac: CPU, Memory, Energy, Disk and Network, every number at the bottom, the View menu and the ⓘ button.
Readings, apps and files in the pictures are from a made-up Mac.