How to check CPU usage on a Mac
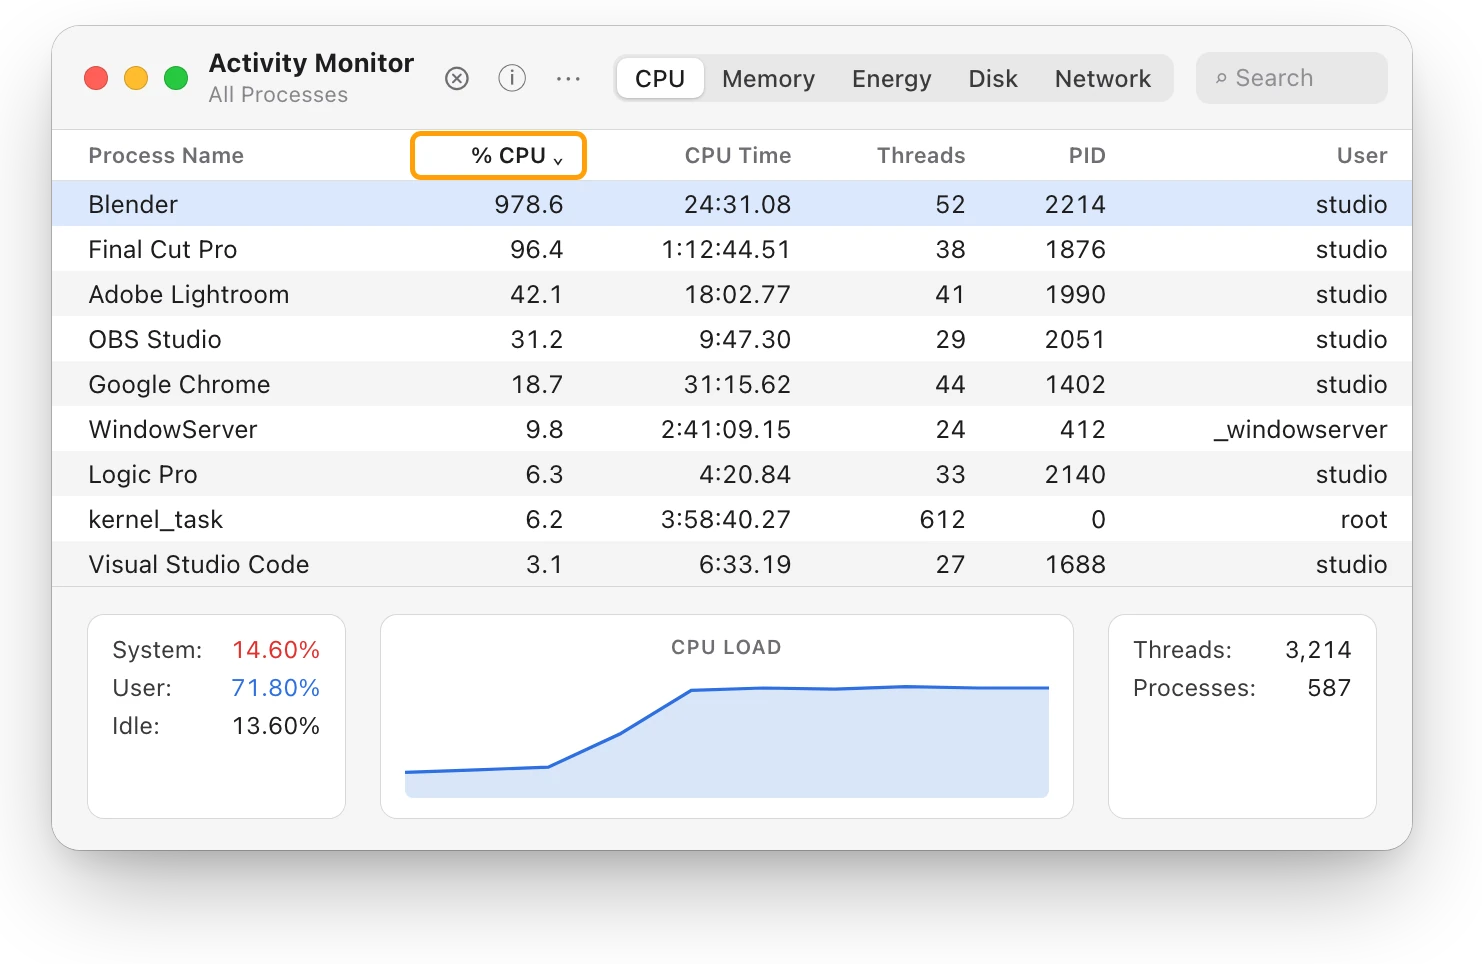
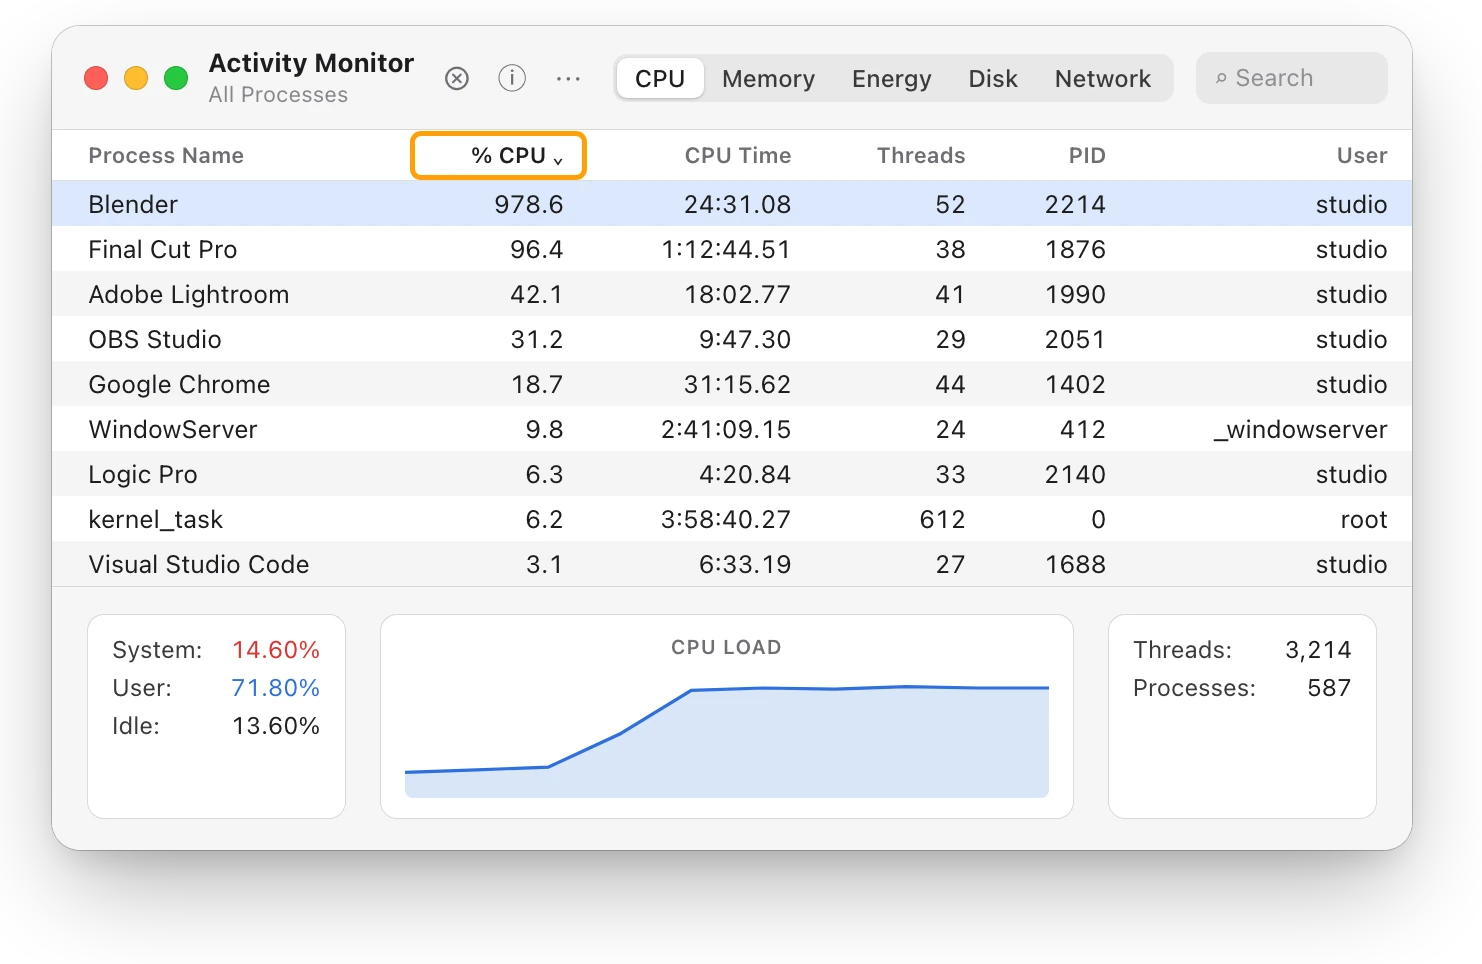
To check CPU usage on a Mac, open Activity Monitor and click CPU. The % CPU column shows each process’s share of the processor, and the bottom of the window shows System, User and Idle for the whole Mac. Activity Monitor counts each core as 100%, so one busy app can show far more than 100%.
How do I check CPU usage in Activity Monitor?
- Open Activity Monitor. It’s in Applications > Utilities, or press Command–Space bar, type Activity Monitor and press Return.
- Click CPU at the top of the window.
- Click the % CPU column heading to sort the list, busiest first.
- Read the bottom of the window for the whole Mac.
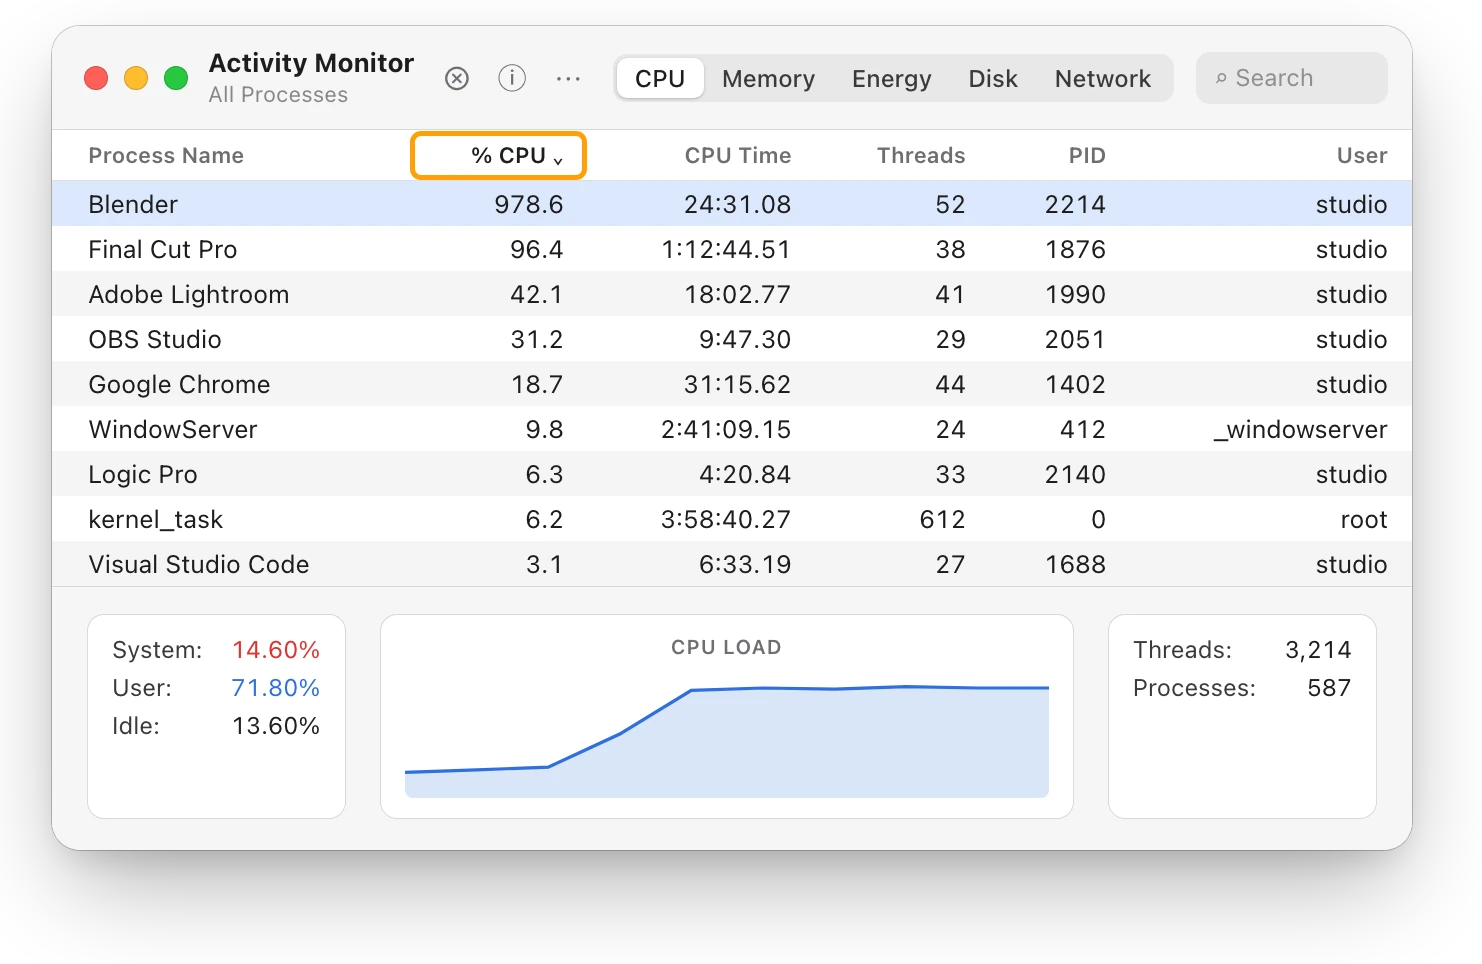
Activity Monitor updates every 5 seconds. A number that jumps for a moment, when an app opens or saves, is normal. A process that stays near the top for minutes is doing sustained work. Which app is slowing down my Mac? covers what to do about it.
Why is CPU usage over 100% on a Mac?
Because Activity Monitor’s % CPU counts each processor core as 100%. A Mac has several cores, so a process working on many of them at once can add up to more than 100%.
| Mac | Most % CPU one process can show |
|---|---|
| 8 cores | 800% |
| 10 cores | 1,000% |
| 15 cores | 1,500% |
On this 15-core MacBook Pro, Blender shows 978.6%: the work of almost ten cores. As a share of the whole processor, that’s 978.6 ÷ 15 = 65.2%. About This Mac names your Mac’s chip, and Apple’s Tech Specs page for your model lists its cores: How to check your Mac’s specs shows where.
What do System, User and Idle mean?
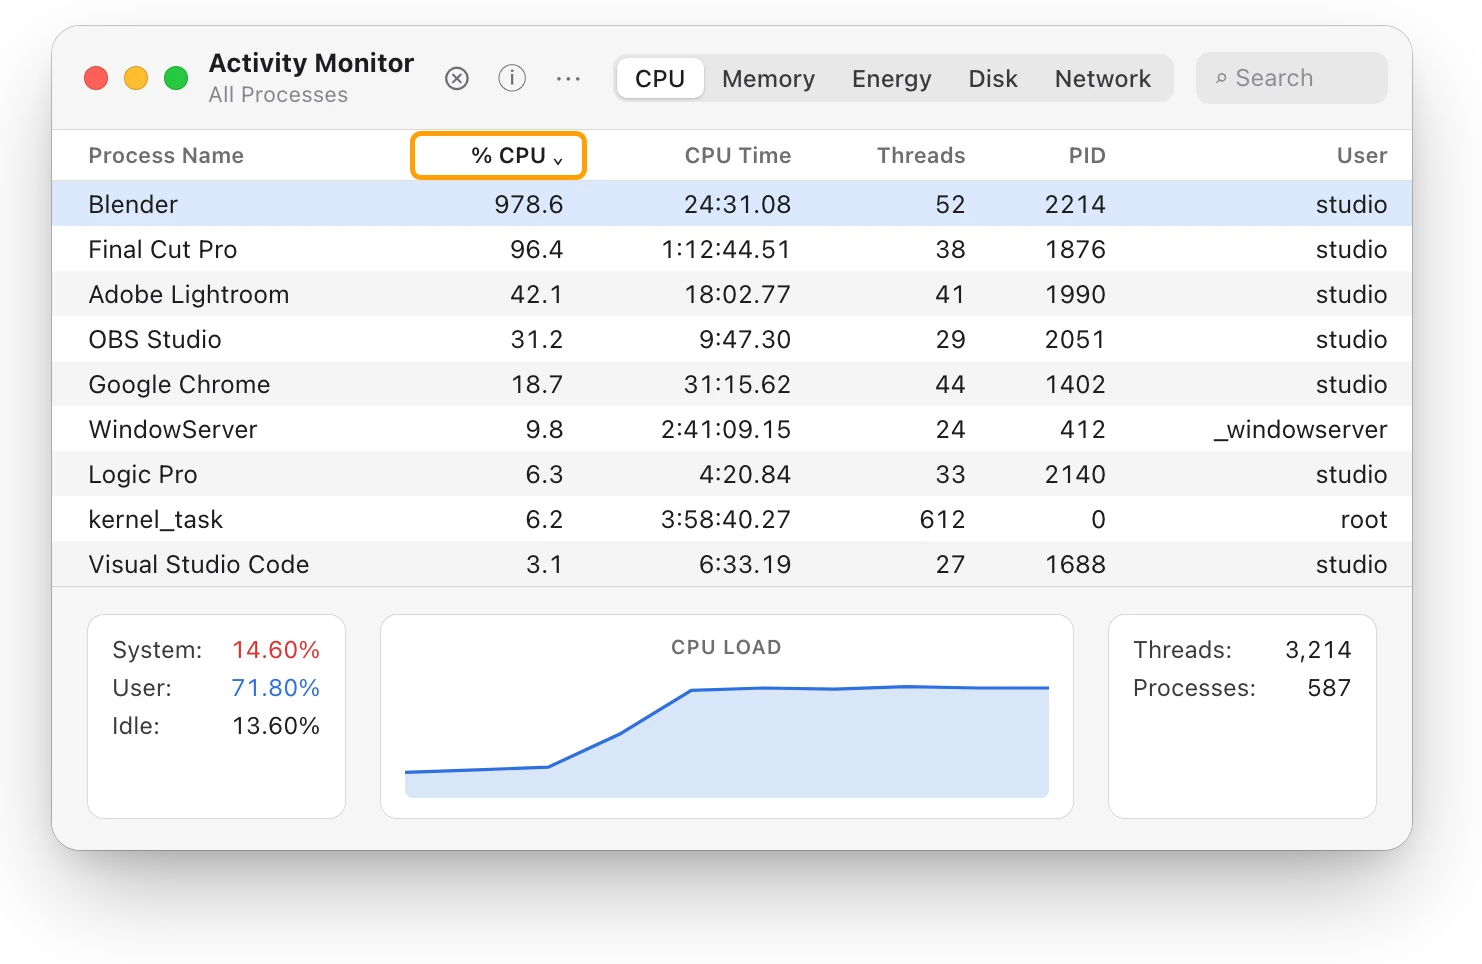
The three numbers at the bottom of the CPU tab are shares of the whole processor, and they add up to 100%.
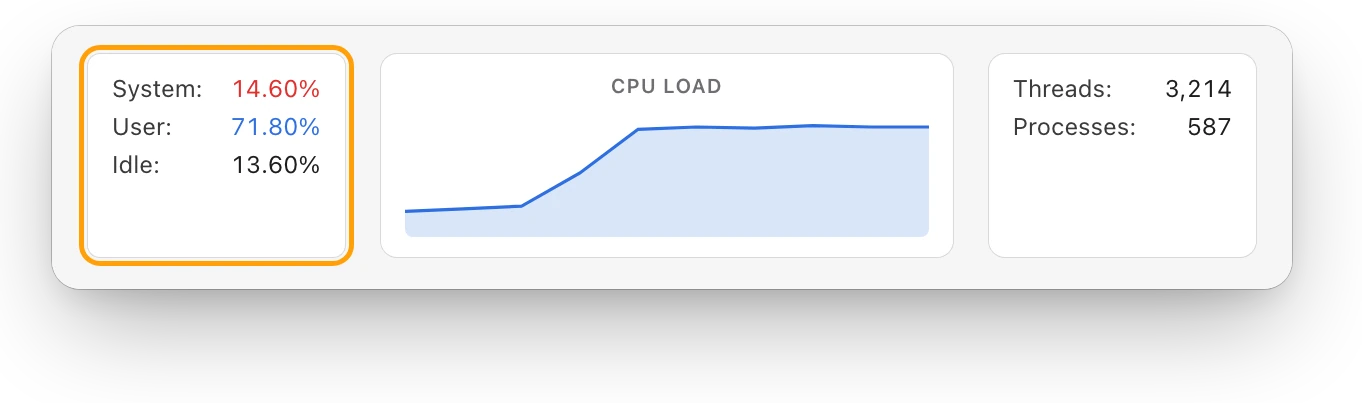
- System: the share used by processes that belong to macOS (14.60% here).
- User: the share used by apps you opened, and the processes they opened (71.80%).
- Idle: the share not being used (13.60%).
So User plus System is your Mac’s total CPU usage: 71.80% + 14.60% = 86.40%. The graph beside them shows the load over the last moments. Below it, Threads and Processes count how many are open.
How do I see CPU usage over time?
Activity Monitor has two small windows for this:
- Window > CPU Usage shows the processor’s activity right now.
- Window > CPU History shows its recent activity.
Each opens in its own window, so you can keep it beside your work. To change how often the numbers refresh, choose View > Update Frequency. Apple notes that updating more often may affect your Mac’s performance.
Can I see CPU usage in the Dock?
Yes. Activity Monitor’s Dock icon can become a live CPU graph:
- Open Activity Monitor.
- Choose View > Dock Icon.
- Choose the Show CPU option you want.
The icon shows the graph while Activity Monitor is open. To keep it in the Dock, Control-click the icon, then choose Options > Keep in Dock.
How do I check CPU usage in Terminal?
The top command lists processes by CPU use, busiest first.
- Open Terminal. It’s in Applications > Utilities.
- Type this and press Return:
top -o cpu- Read the line that starts with “CPU usage:”. It splits the processor’s use into user, sys and idle, like Activity Monitor’s User, System and Idle.
- Press q to quit
top.
Its manual page (man top in Terminal) says -o cpu orders the list by CPU usage, and the display updates every second by default.
Which way should I use?
| Method | Where | What you see | Best for |
|---|---|---|---|
| CPU tab | Activity Monitor | Every process’s % CPU, and System, User, Idle | Finding the busy app |
| CPU Usage window | Activity Monitor > Window | The processor’s activity right now | A quick look |
| CPU History window | Activity Monitor > Window | The last few minutes | Spotting what’s lasting |
| Dock icon | Activity Monitor > View > Dock Icon | A live graph in the Dock | Keeping an eye on it all day |
top -o cpu | Terminal | Processes, busiest first, and the CPU usage line | Working in Terminal |
What’s a normal CPU usage on a Mac?
Apple says the processor usually uses only a small percentage of its power, and more when apps need intensive calculation. Apple gives no number for “normal”. What matters is how long it lasts: a burst while an app opens is fine, and a processor busy for minutes, with Idle near zero, is worth a look.
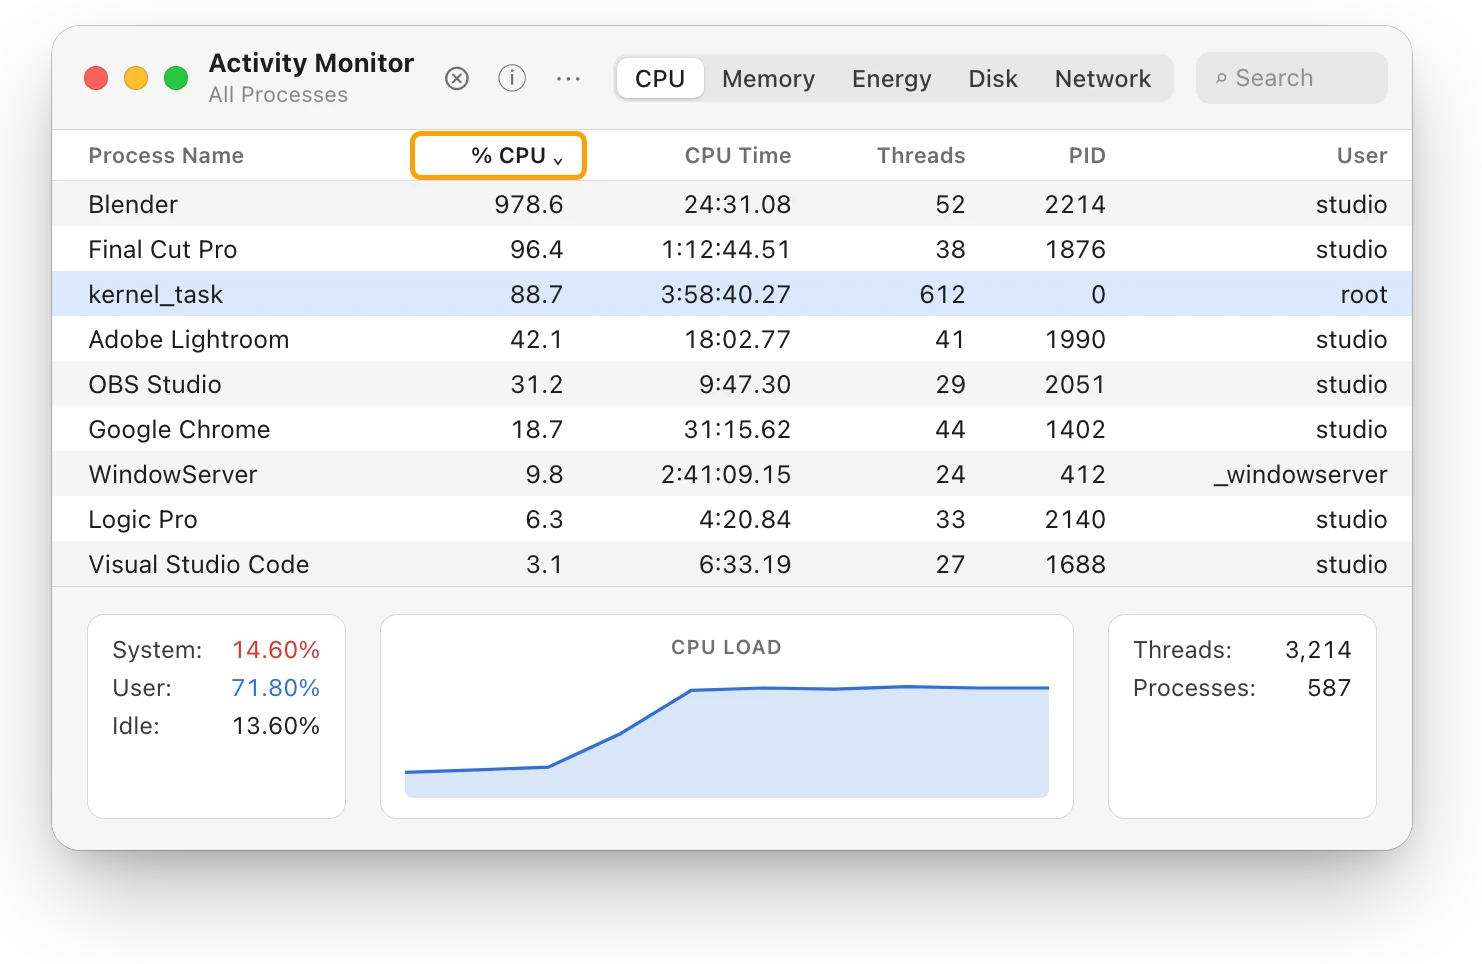
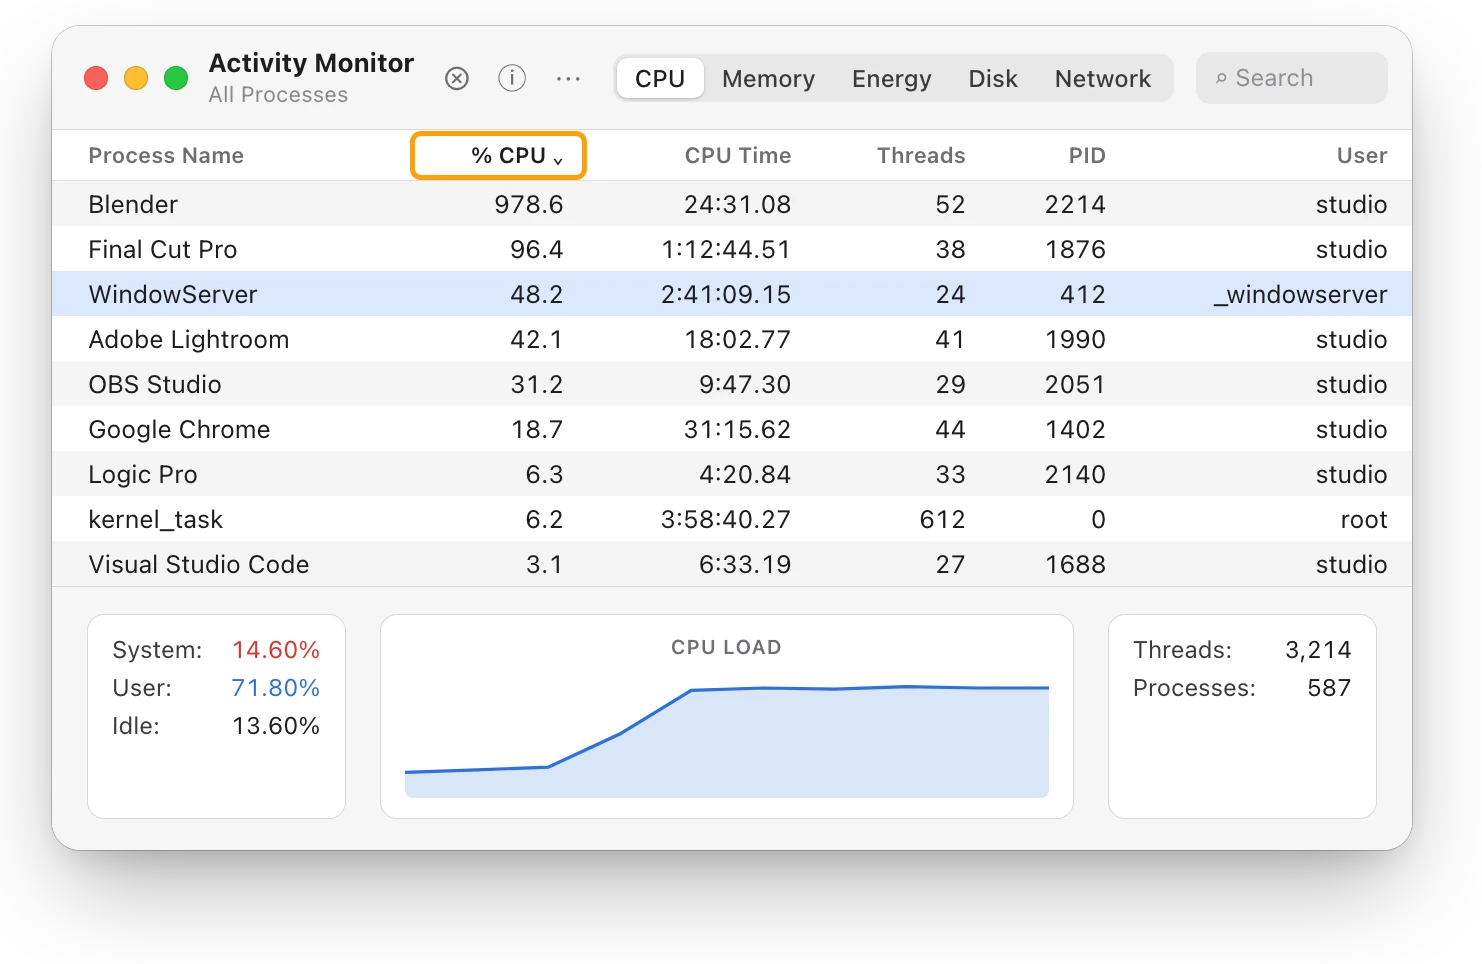
Two macOS processes often look alarming. kernel_task rises when the processor is getting hot, to keep it cool; kernel_task high CPU? explains it. WindowServer draws everything on your screen; WindowServer using high CPU? covers when it works hard.
Questions people also ask
Is it bad if my Mac’s CPU is at 100%?
Not for a while. Exports, renders and builds use every core, and the Mac eases off when they finish. If the processor stays busy for minutes without heavy work, sort the CPU tab by % CPU to find what’s running.
Why does Activity Monitor show high CPU when nothing is open?
Something may be working without a window, such as an app that opens at login, a sync or Spotlight indexing. Choose View > All Processes, then sort by % CPU to see it.
Does Activity Monitor show GPU usage?
Yes. Choose Window > GPU History to see how hard the graphics processor has been working.
How do I check CPU usage on a Mac without Activity Monitor?
Use top -o cpu in Terminal, which lists processes by CPU use and shows the user, sys and idle split at the top.
Scope for Mac · Free, coming to the Mac App Store
How Scope helps
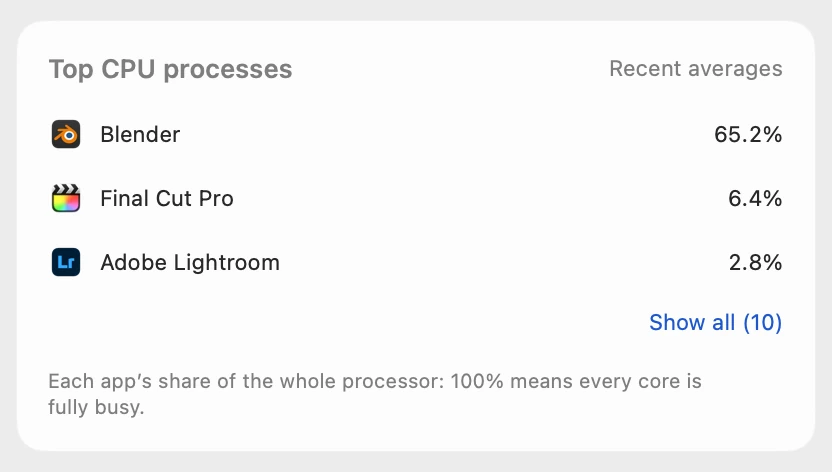
Scope is a free Mac menu bar app that shows your Mac’s CPU use as one number for the whole processor, beside the processes using the most of it and the last few minutes of history. You see how busy your Mac is, and why, without opening Activity Monitor.
In your menu bar
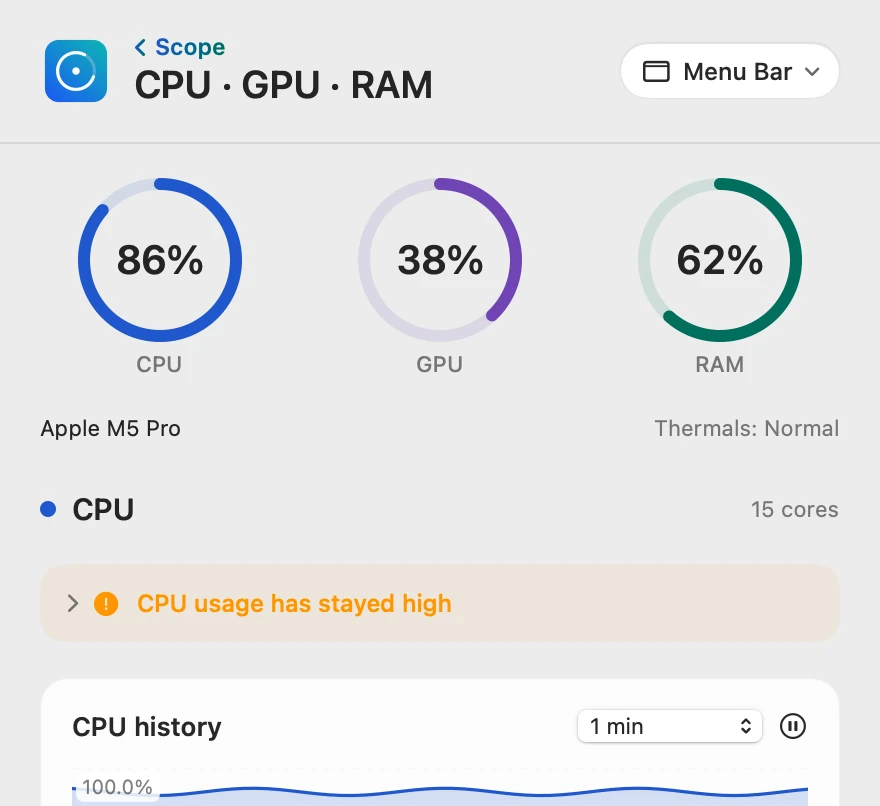
CPU · GPU · RAM shows the live CPU figure in your menu bar, so a busy processor shows before you go looking. Scope Free keeps one whole menu bar item of your choice.

One number for the whole Mac
Scope’s CPU figure matches Activity Monitor’s User plus System: 71.80% + 14.60% is about 86%. Its process list shares the whole processor too, so 100% means every core is busy: Blender’s 978.6% on 15 cores is 978.6 ÷ 15 = 65.2%. The list shows the apps you run, not macOS’s background processes such as kernel_task.
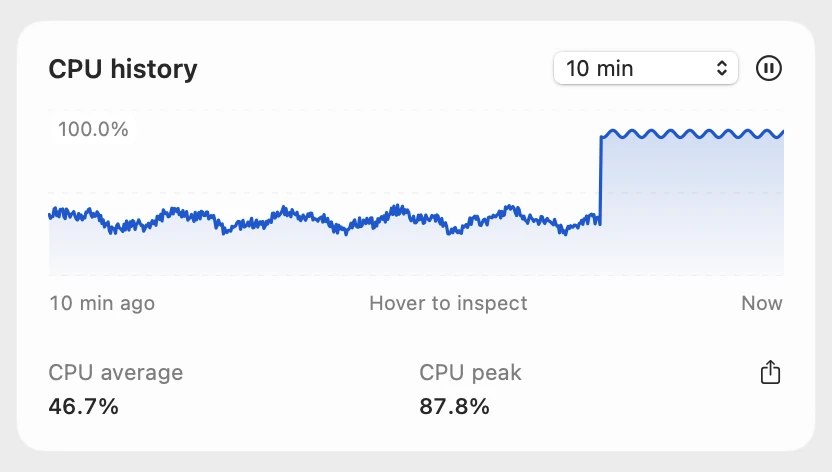
The last ten minutes
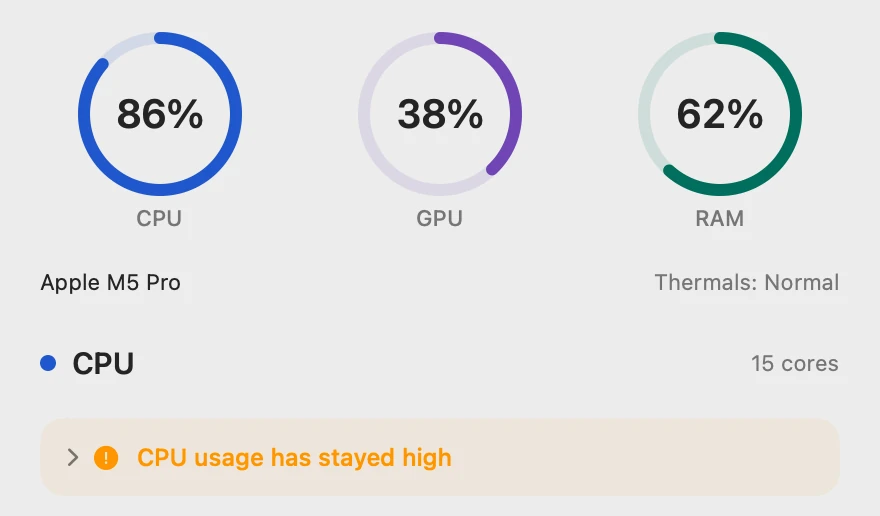
The chart shows when the load began and whether it’s lasting. Scope Free keeps the last 1, 5 and 10 minutes; Scope Pro keeps 24 hours.
Scope shows and explains. It never quits apps or changes your settings, so what to close stays your call.
Try it here
The real Scope, working, right in this page.
Click any item in the menu bar, or a card inside, as you would on your Mac.
Scope Pro Every menu bar item is shown here. Scope Free keeps one whole item of your choice, with every reading inside.
See your own Mac’s CPU at a glance.
Keep reading
Guide · Slow Mac
Why is my Mac slow? How to find the cause
A slow Mac is usually a busy app, too little memory, a nearly full disk or heat. Here’s how to see which one with macOS’s own tools.
Slow Mac
Which app is slowing down my Mac? How to find it
Activity Monitor shows which app is slowing your Mac: sort by % CPU, then by Memory. Here’s how to read the lists, and what to do next.
Heat
kernel_task high CPU? Your Mac is cooling itself
High kernel_task CPU means your Mac is too hot: macOS holds the processor back while it cools. Find the app making the heat, and give your Mac air.
Slow Mac
WindowServer using high CPU on a Mac? What it means
WindowServer is the part of macOS that puts your apps’ windows on screen. If its CPU stays high, look for the busy apps and close what you don’t need.
Your Mac
Activity Monitor on a Mac: every tab explained
What each Activity Monitor tab shows on a Mac: CPU, Memory, Energy, Disk and Network, every number at the bottom, the View menu and the ⓘ button.
Sources
- Apple Support: View CPU activity in Activity Monitor on Mac
- Apple Support: View GPU activity in Activity Monitor on Mac
- Apple Support: View information about Mac processes in Activity Monitor
- Apple Support: Change how often information is updated in Activity Monitor on Mac
- Apple Support: If kernel_task is using a large percentage of your Mac CPU
- Apple Support: Use the Dock on Mac
Last checked October 18, 2026. Readings, apps and files in the pictures are from a made-up Mac.