WindowServer using high CPU on a Mac? What it means
On a Mac, WindowServer is the part of macOS that manages your apps’ windows and draws them on the screen, so it runs all the time and always shows up in Activity Monitor. When WindowServer’s CPU stays high, find the apps that are busy at the same moment in Activity Monitor and quit the ones you don’t need. Leave WindowServer itself running: it belongs to macOS.
What is WindowServer?
WindowServer is a process that belongs to macOS, not an app you opened. Apple’s developer documentation describes the window server as the part of macOS that manages app windows, and says that what apps draw is put on screen by the window server. Every app with a window relies on it, from the Finder to your browser.
In Activity Monitor, WindowServer’s User column reads _windowserver, not your account name. Apple lists WindowServer as a macOS component in its security notes for macOS updates, so it’s updated with macOS like the rest of the system.
Why is WindowServer using so much CPU?
WindowServer puts on screen what your apps draw, so its work depends on them. Apple doesn’t publish a normal range for WindowServer’s CPU use, so the useful question is what else is busy at the same moment.
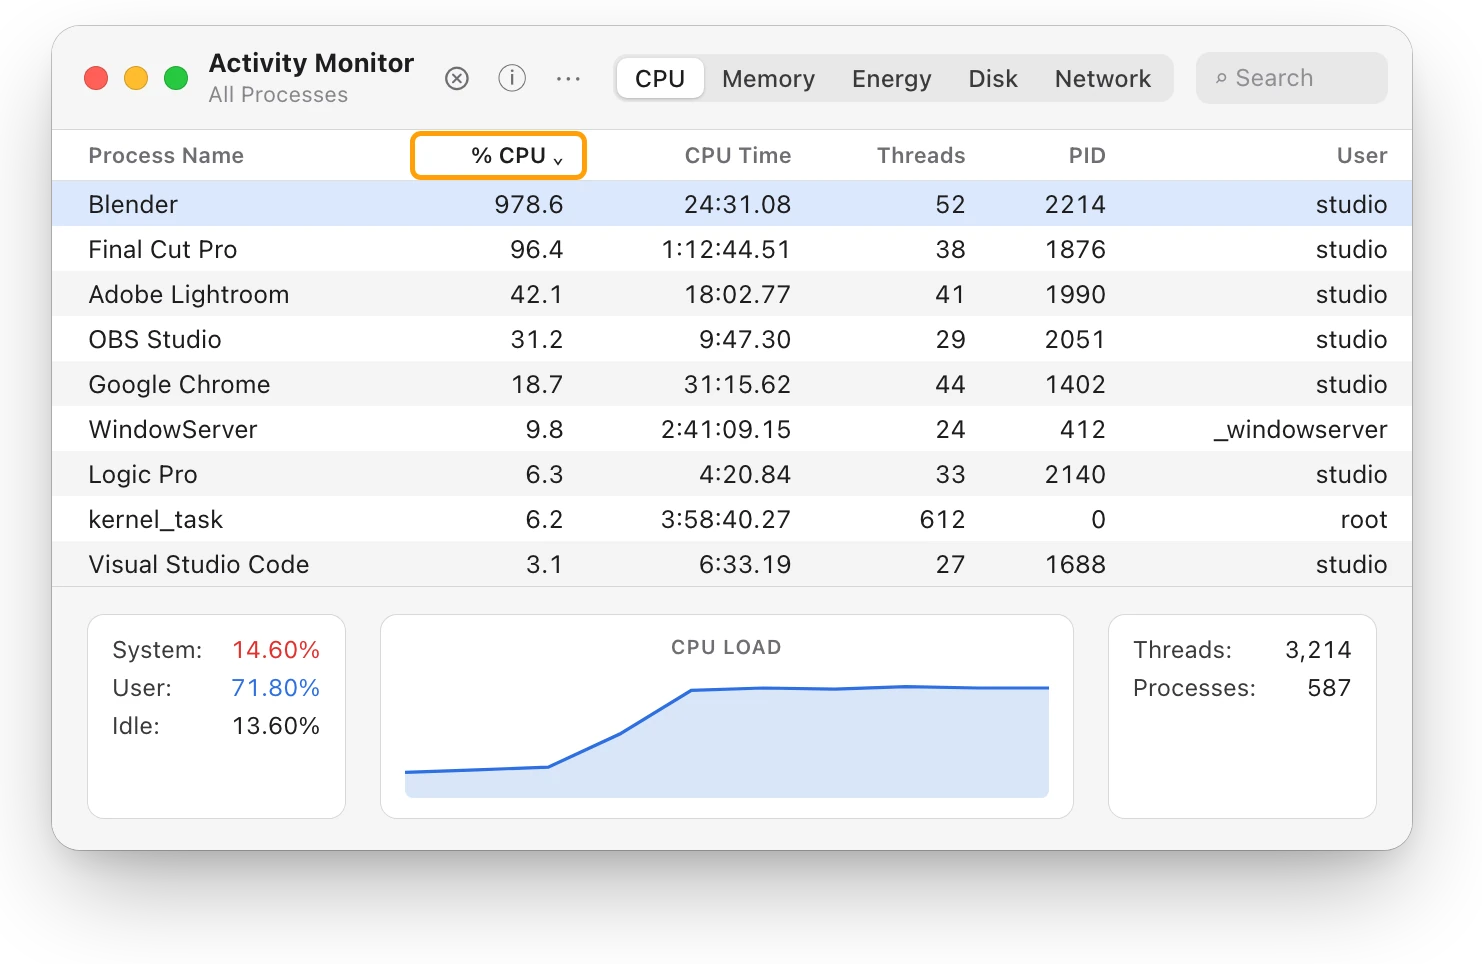
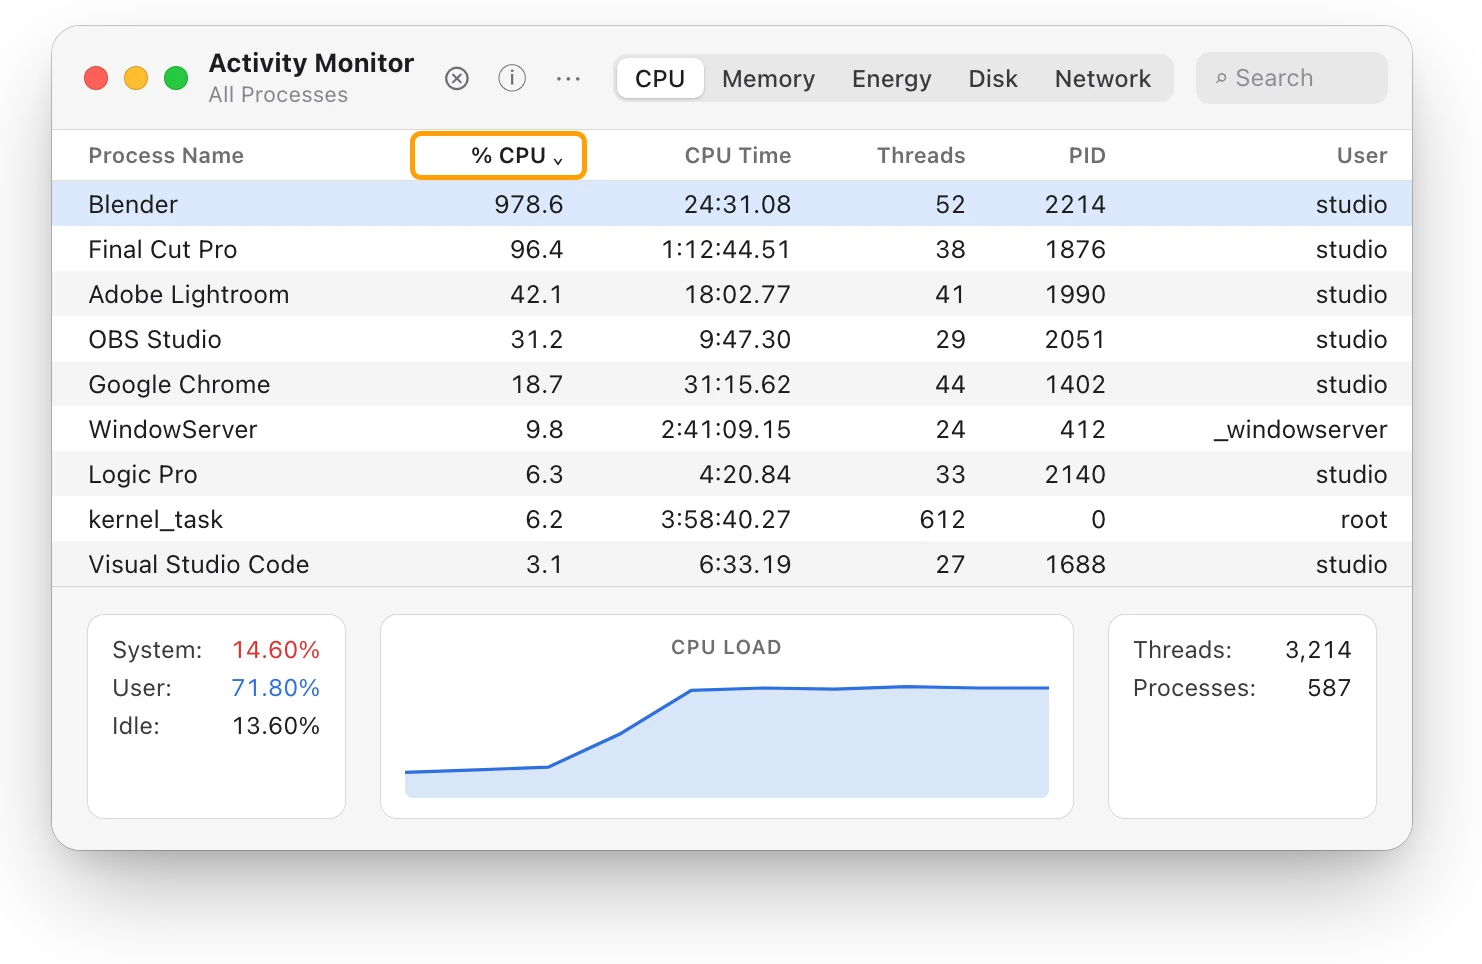
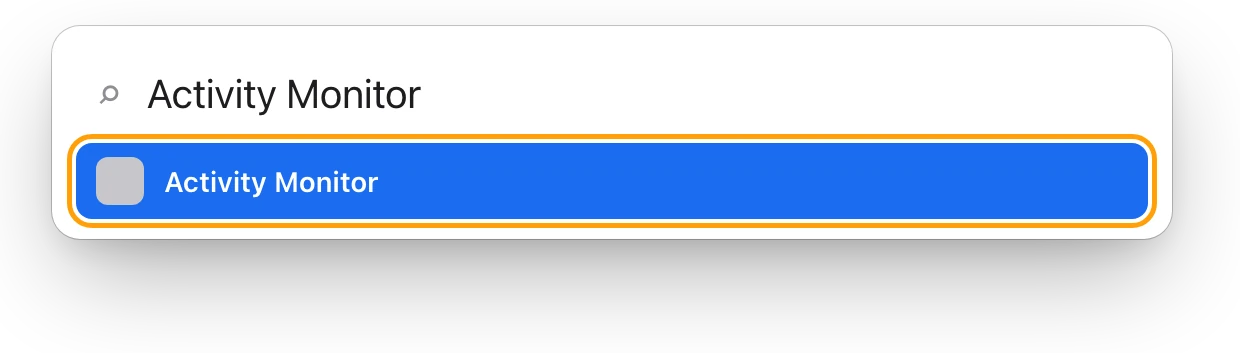
- Open Activity Monitor. It’s in Applications > Utilities, or press Command–Space bar, type Activity Monitor and press Return.
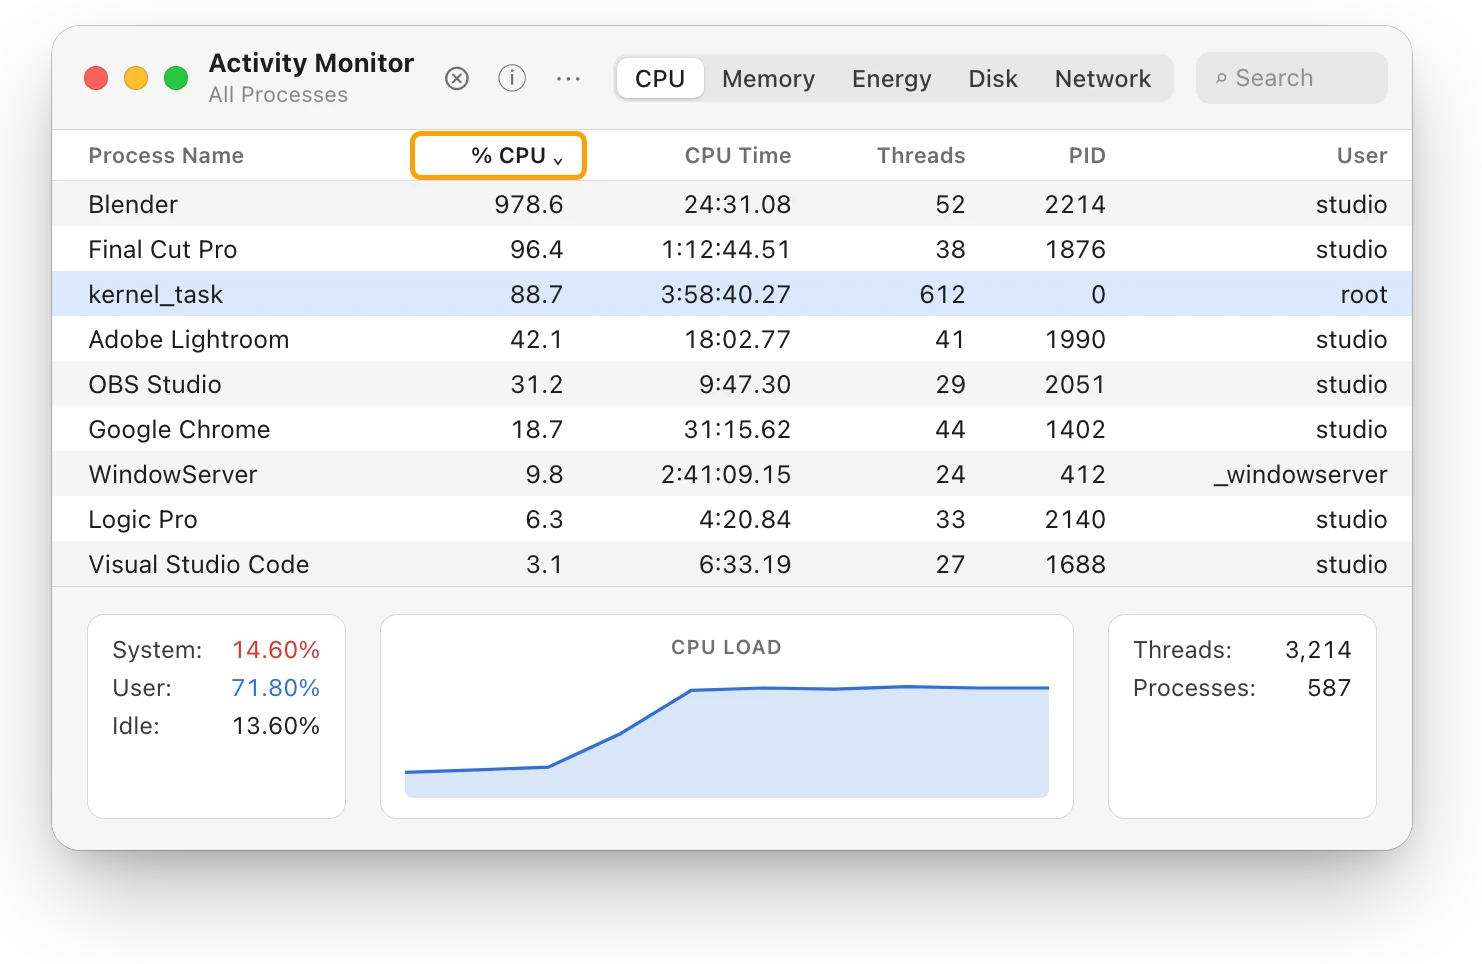
- Click CPU, then click the % CPU column heading to sort the list, busiest first.
- Find WindowServer, then look at the apps above and around it. An app that stays near the top for minutes is the one doing the most work.
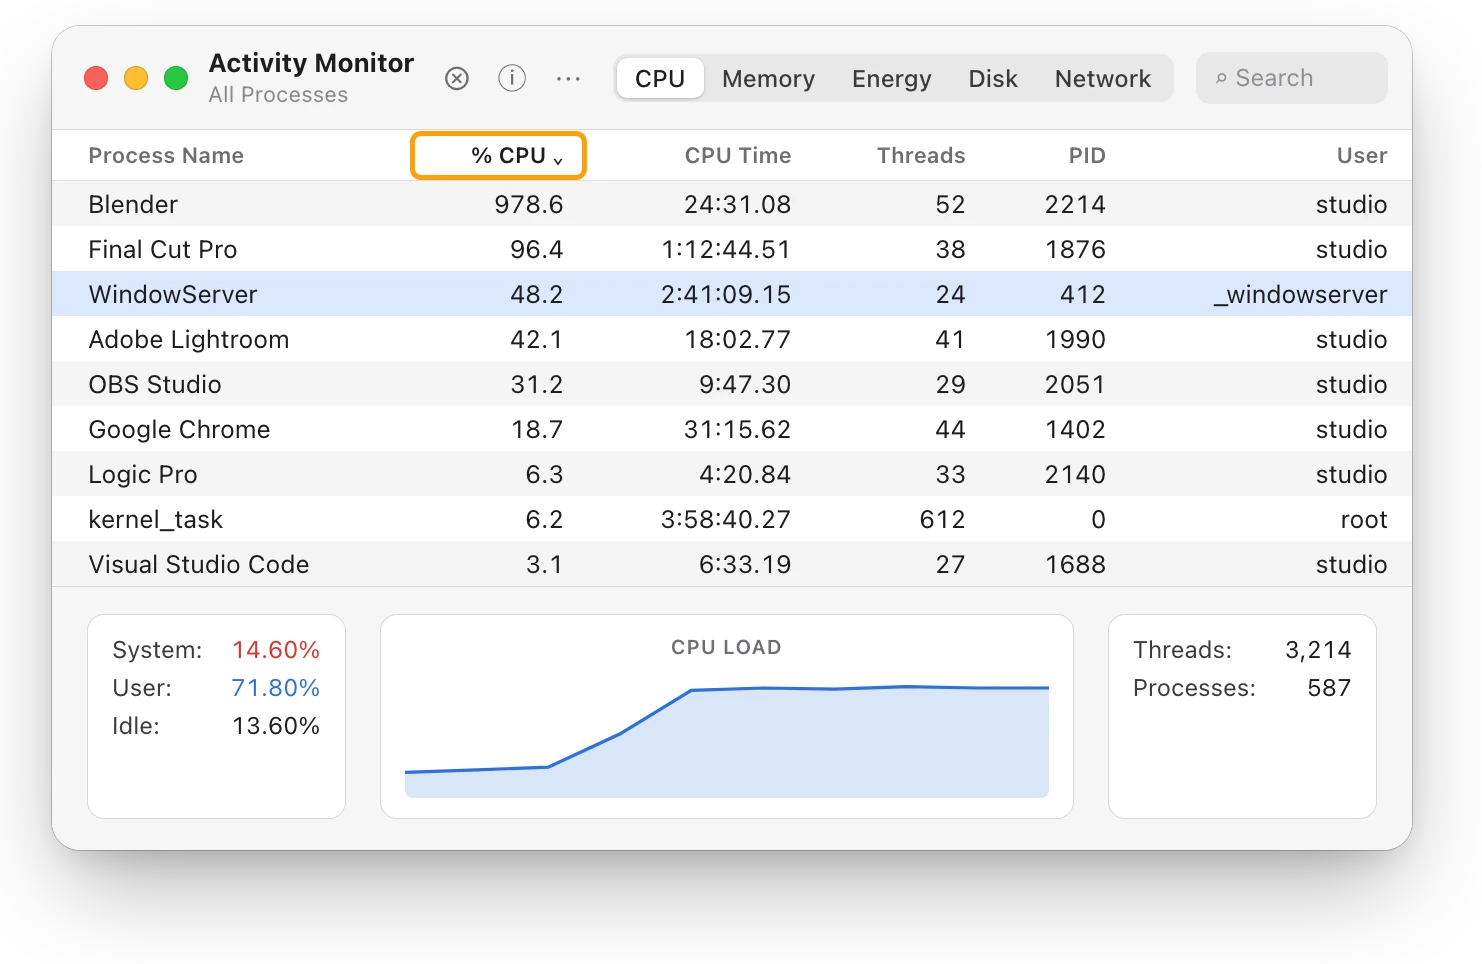
Activity Monitor counts each processor core as 100%. So WindowServer’s 48.2% is about half of one core, on a MacBook Pro with 15 cores. At the bottom of the window, System is the share of the processor used by processes that belong to macOS, WindowServer among them, and User is the share used by the apps you opened. Here User, 71.80%, is far larger than System, 14.60%: your apps are doing most of the work.
How do I bring WindowServer’s CPU down?
Give it less to do, by closing what you aren’t using.
- Quit apps you’re not using. Apple’s advice for a slow Mac includes quitting any apps you’re not using. Save your work, then choose Quit from each app’s menu, or press Command-Q.
- See which apps have windows. In Activity Monitor, choose View > Windowed Processes. It shows the processes that can create a window, which are usually apps.
- Let busy work finish. If an app is rendering, exporting or playing a game you chose, its work will end, and the rest of your Mac gets more room.
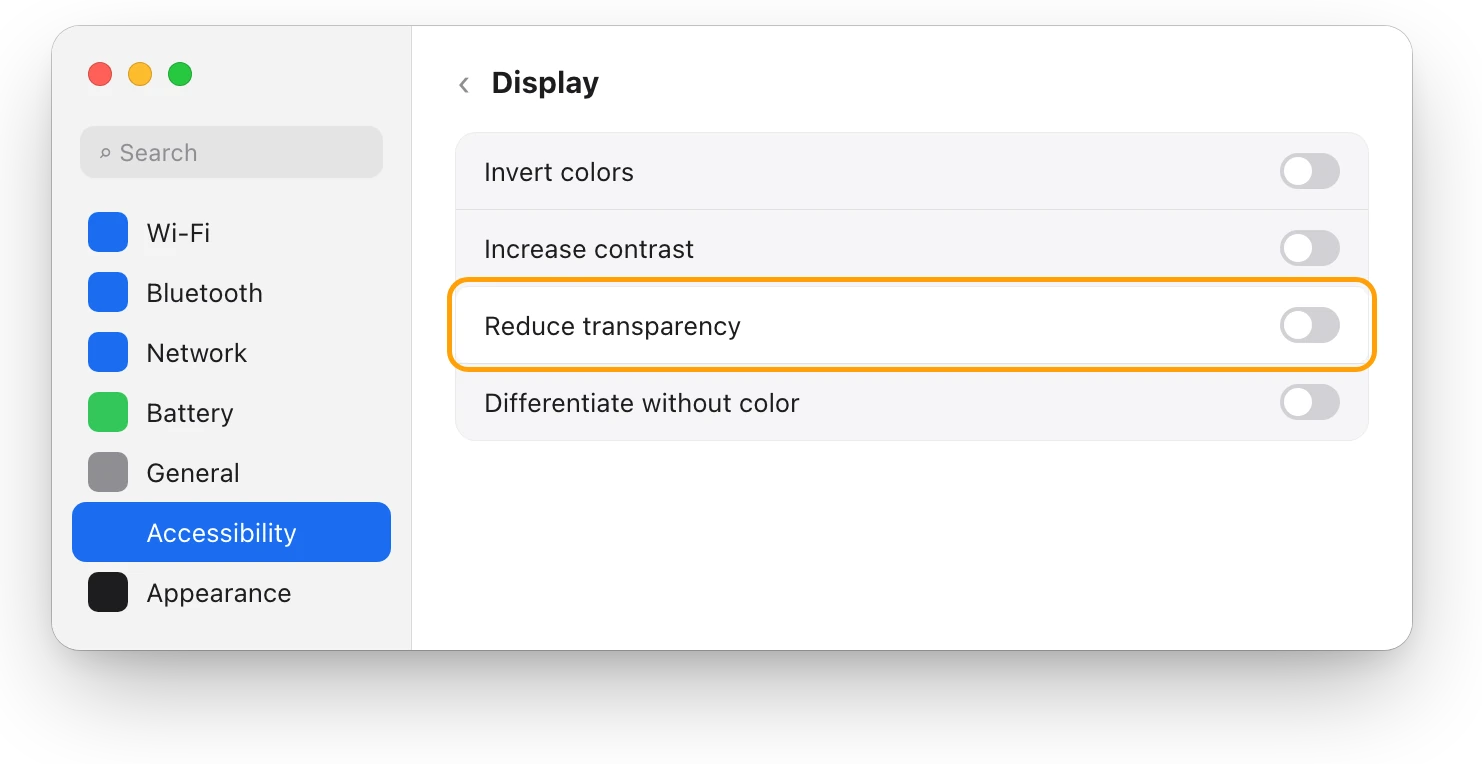
- Try Reduce transparency, and compare. Choose Apple menu > System Settings, click Accessibility, then click Display, and turn on Reduce transparency. It replaces the see-through backgrounds in macOS with solid ones. Apple describes it as a way to improve contrast and readability and doesn’t say it changes CPU use, so watch WindowServer’s % CPU before and after, and keep it on only if it helps you.
Should I quit WindowServer?
No. WindowServer is part of macOS, and every app’s windows depend on it. Apple warns that if a process is used by other apps or processes, those apps or processes could have problems after you force it to quit. WindowServer also belongs to macOS rather than your account, so Activity Monitor may ask for an administrator’s name and password before it would quit it. Quit the busy apps instead.
Why is WindowServer using so much memory?
Memory is part of how WindowServer does its job, and Apple doesn’t publish a normal amount for it. Before you worry about any one number, check how your whole Mac is doing.
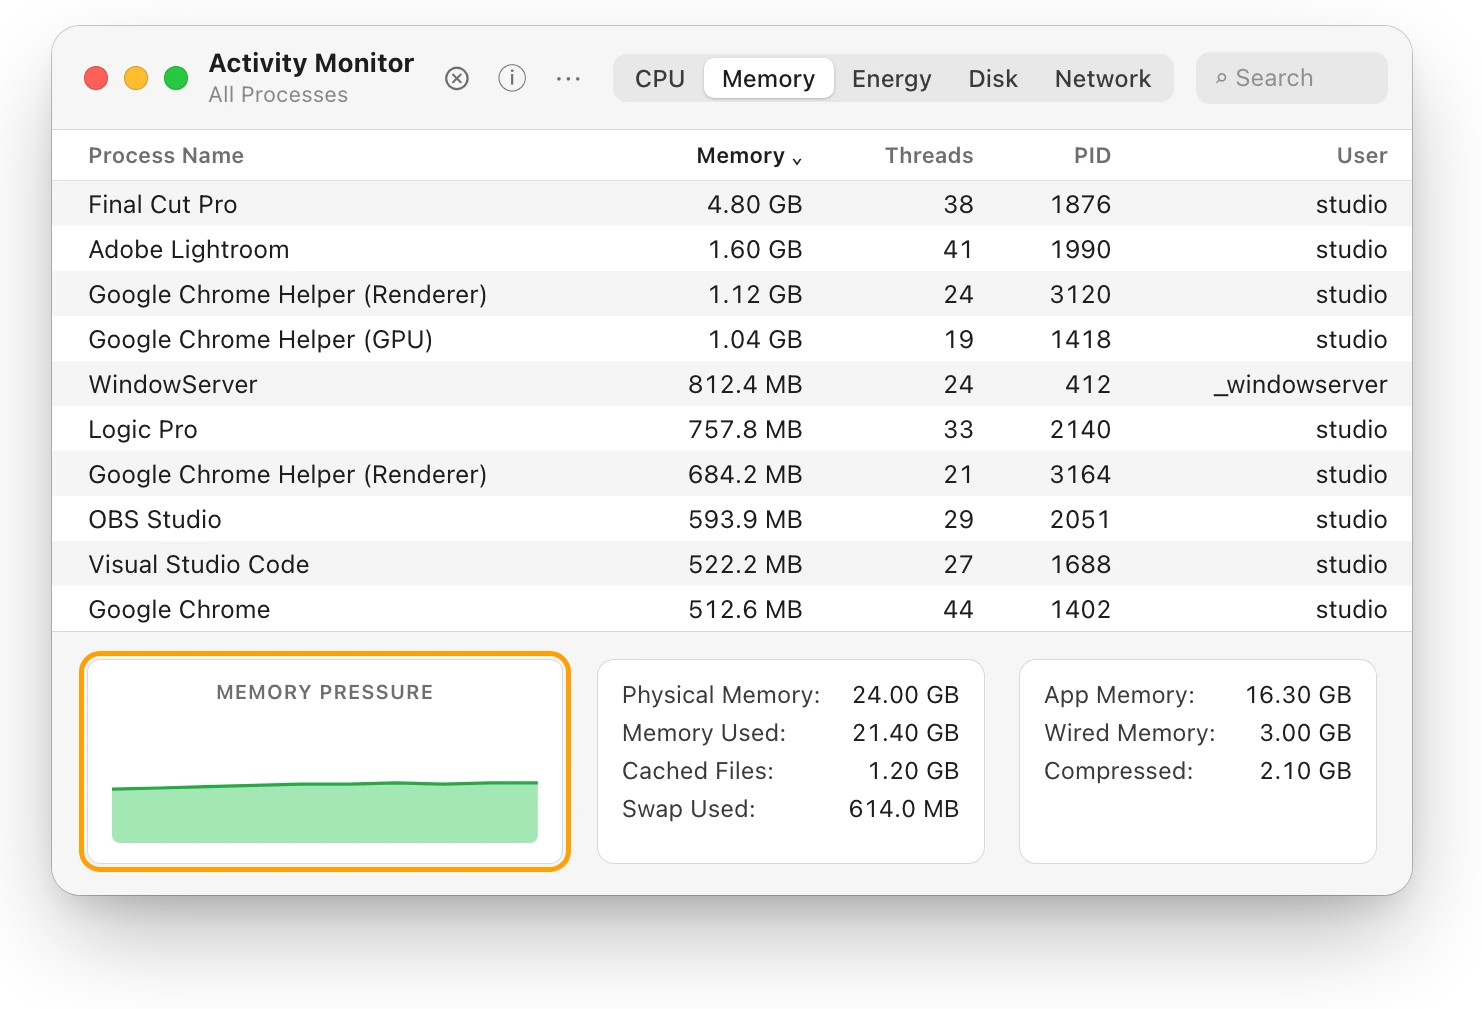
- In Activity Monitor, click Memory, then click the Memory column heading to sort by it.
- Look at the Memory Pressure graph at the bottom of the window.
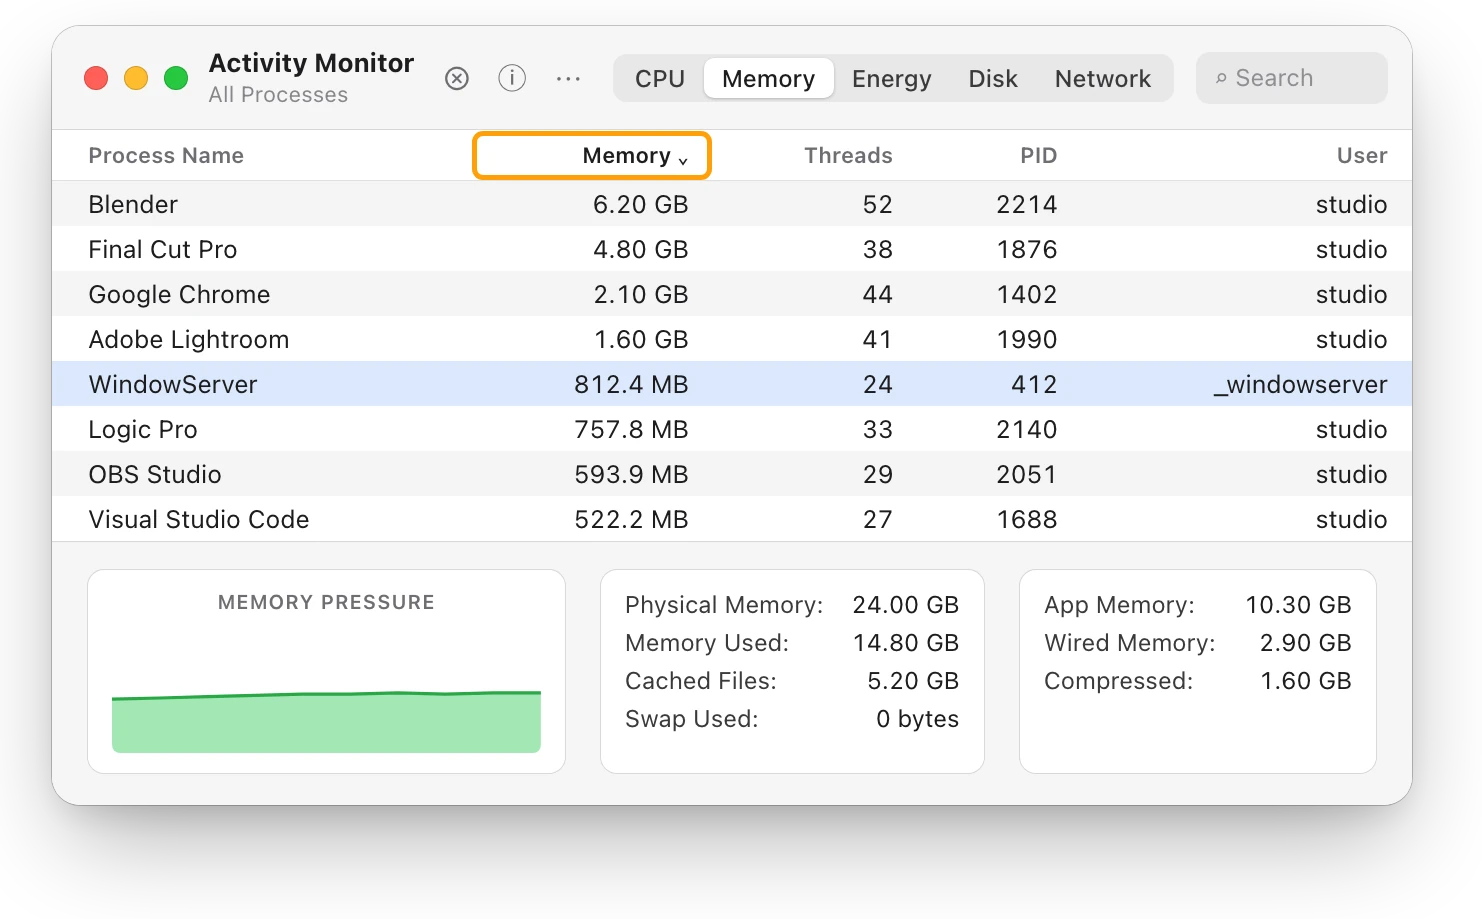
Green means your Mac is using its memory efficiently, even if most of it is in use. Yellow or red means it’s short of memory, and the apps at the top of the Memory list are the ones to close first. Mac memory pressure: why high RAM use is often fine explains the graph.
Questions people also ask
Is WindowServer a virus?
No. WindowServer is part of macOS, and Apple fixes and updates it in macOS updates, as its security notes show.
What is a normal WindowServer CPU use?
Apple doesn’t publish one. Compare it with the apps around it in Activity Monitor’s CPU list: if an app stays busier, start there.
Why does WindowServer count as System, not User?
Activity Monitor’s System share is the processor time used by processes that belong to macOS, and WindowServer is one of them. User is what the apps you opened use.
Is WindowServer the same as kernel_task?
No. Both belong to macOS, but they do different jobs. Apple says one of kernel_task’s jobs is to help manage the processor’s temperature; kernel_task high CPU? Your Mac is cooling itself explains it.
Scope for Mac · Free, coming to the Mac App Store
How Scope helps
Scope is a free Mac menu bar app that shows your Mac’s total CPU and GPU use and the apps using the most CPU right now. Scope doesn’t list WindowServer or other macOS background processes. Its lists show the apps you run, the ones you can close.
In your menu bar

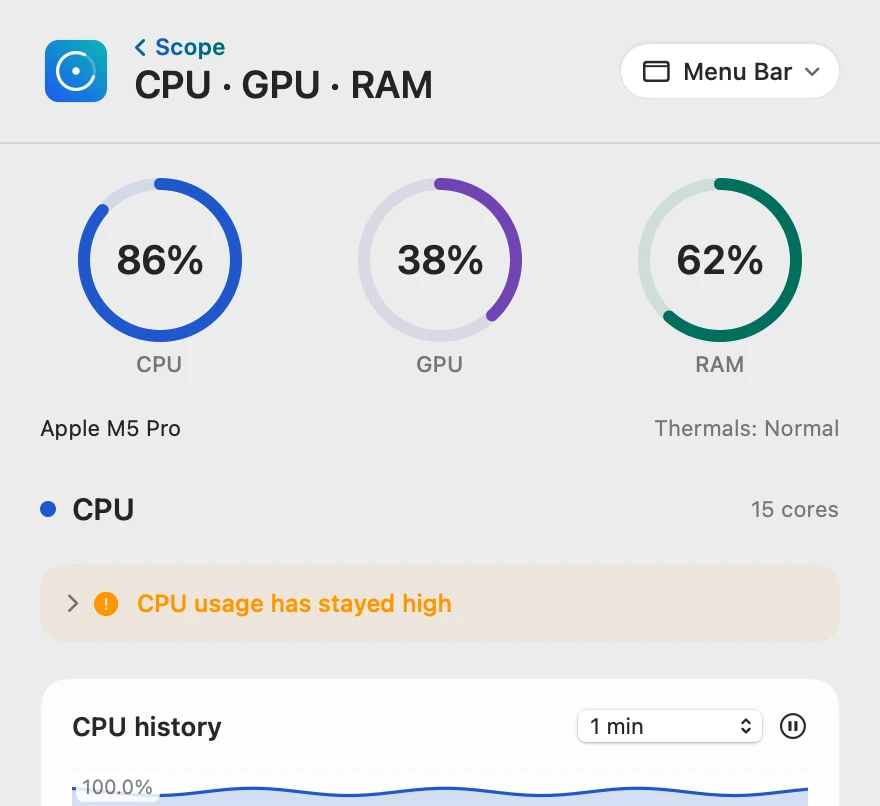
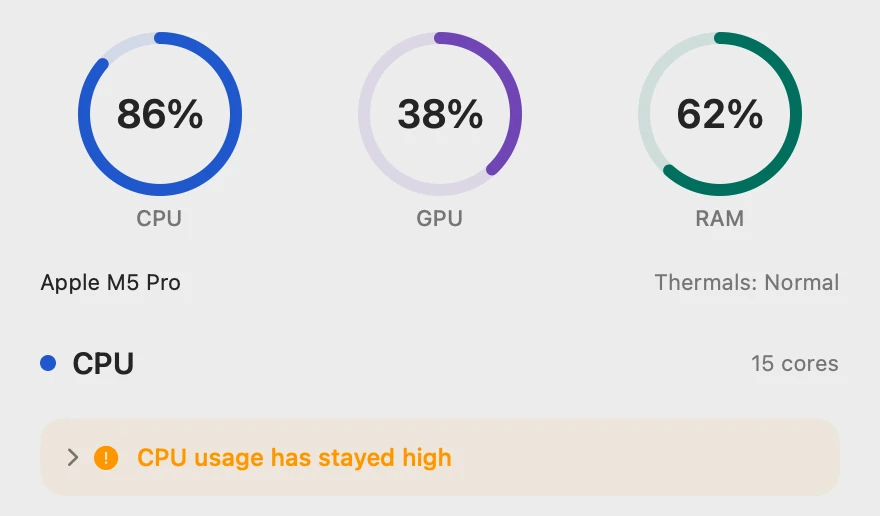
The whole Mac’s CPU and GPU
CPU 86% is the whole Mac’s processor use, Activity Monitor’s System and User added together (14.60% + 71.80%), so WindowServer’s work is in it. GPU 38% is the graphics processor’s use by everything on the Mac.
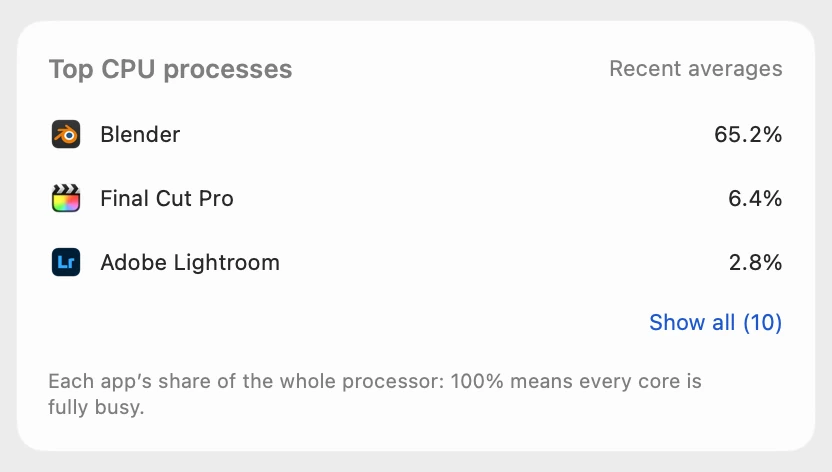
The busiest app
Scope shows each app’s share of the whole processor, so on this 15-core Mac, Blender’s 978.6% in Activity Monitor is 978.6 ÷ 15 = 65.2%. In the same terms, WindowServer’s 48.2% would be about 3.2%. WindowServer isn’t in this list; Activity Monitor shows it and macOS’s other processes.
Scope shows and explains. It doesn’t quit apps or change your settings.
Try it here
The real Scope, working, right in this page.
Click any item in the menu bar, or a card inside, as you would on your Mac.
Scope Pro Every menu bar item is shown here. Scope Free keeps one whole item of your choice, with every reading inside.
See what’s busy on your own Mac.
Keep reading
Guide · Slow Mac
Why is my Mac slow? How to find the cause
A slow Mac is usually a busy app, too little memory, a nearly full disk or heat. Here’s how to see which one with macOS’s own tools.
Slow Mac
Which app is slowing down my Mac? How to find it
Activity Monitor shows which app is slowing your Mac: sort by % CPU, then by Memory. Here’s how to read the lists, and what to do next.
Heat
kernel_task high CPU? Your Mac is cooling itself
High kernel_task CPU means your Mac is too hot: macOS holds the processor back while it cools. Find the app making the heat, and give your Mac air.
Your Mac
Task Manager on a Mac: how to open it
The Mac’s Task Manager is Activity Monitor. Open it with Spotlight, quit a frozen app with Option-Command-Esc, and see what replaces each Windows tool.
Slow Mac
Mac memory pressure: why high RAM use is often fine
Memory pressure, not RAM in use, shows if your Mac has enough memory. Green is fine even when RAM is nearly full; yellow or red means it’s running short.
Sources
- Apple Developer: Quartz Window Services
- Apple Developer: Measuring Drawing Performance
- Apple Support: About the security content of macOS Tahoe 26.3
- Apple Support: View CPU activity in Activity Monitor on Mac
- Apple Support: View information about Mac processes in Activity Monitor
- Apple Support: Quit a process in Activity Monitor on Mac
- Apple Support: If your Mac runs slowly
- Apple Support: Change Display settings for accessibility on Mac
- Apple Support: Check if your Mac needs more RAM in Activity Monitor
- Apple Support: If kernel_task is using a large percentage of your Mac CPU
Last checked October 18, 2026. Readings, apps and files in the pictures are from a made-up Mac.