Mac memory pressure: why high RAM use is often fine
On a Mac, memory pressure shows whether your Mac has enough RAM for what’s open, and it matters more than how much RAM is in use. In Activity Monitor’s Memory tab, a green Memory Pressure graph means macOS is using its memory efficiently, even when nearly all of it is in use. Yellow means memory is getting tight, and red means your Mac needs more memory for that work.
Why is my Mac using almost all of its RAM?
Because macOS puts its memory to work. Apple says free memory doesn’t necessarily mean better performance: macOS performs best when it uses and manages all of its memory efficiently. It keeps recently used files in memory that would otherwise sit empty, and it compresses memory held by inactive apps to make room for active ones.
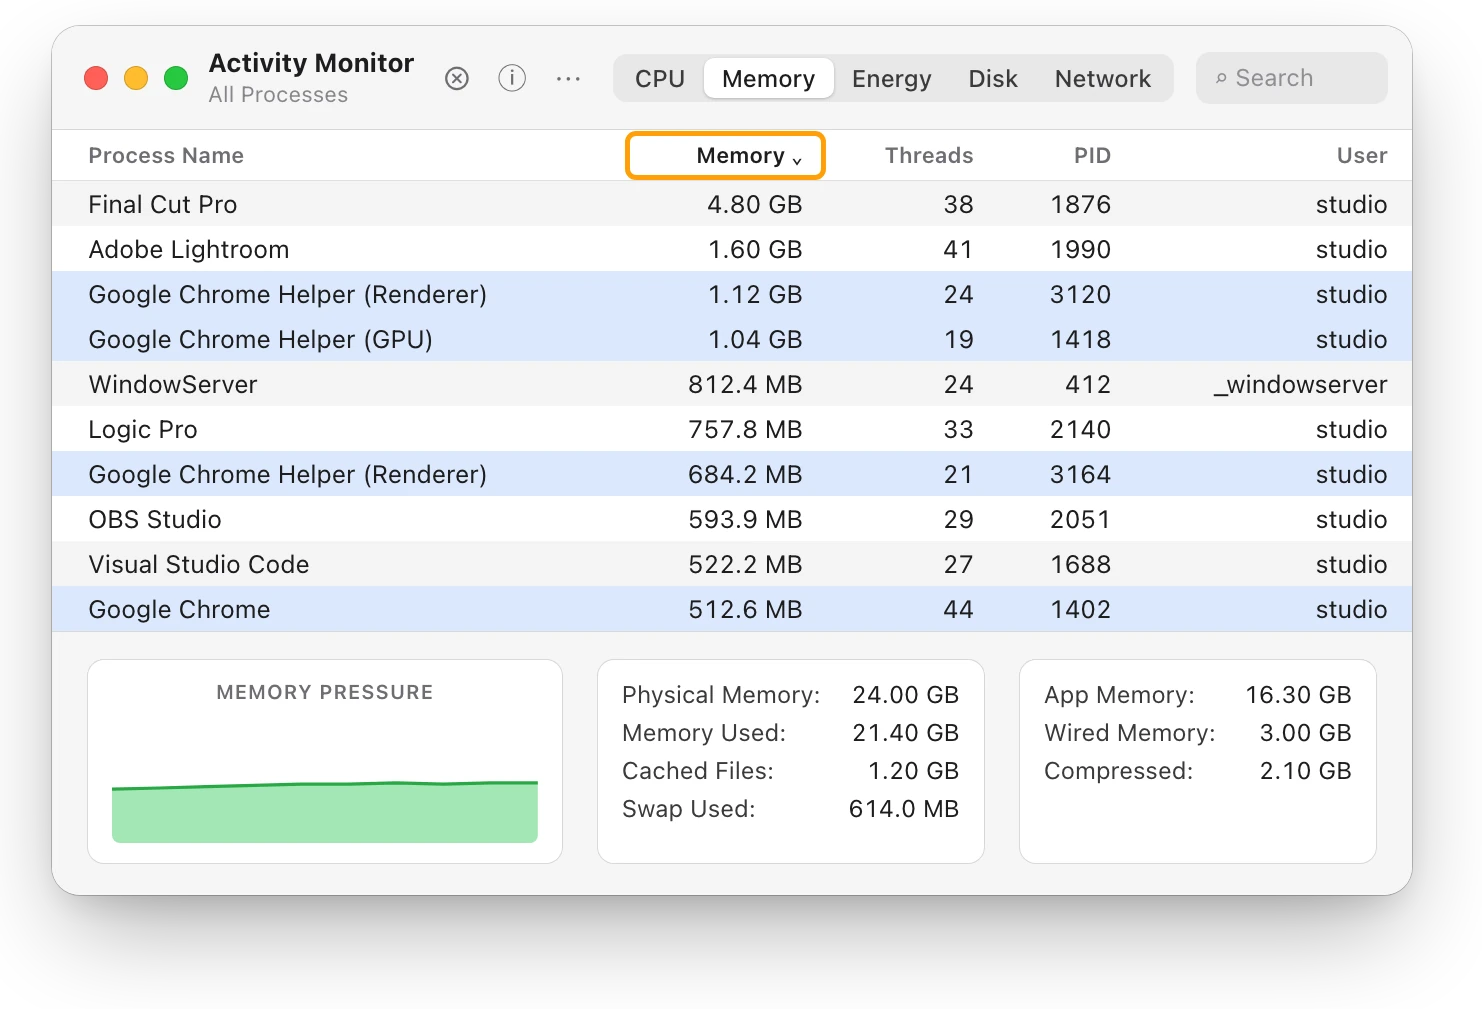
So a Mac with 21.40 GB of its 24 GB in use can be working perfectly well. The number to check is memory pressure.
How do I check memory pressure?
- Open Activity Monitor. It’s in Applications > Utilities, or search for it with Spotlight.
- Click Memory at the top of the window.
- Look at the Memory Pressure graph at the bottom:
- Green: your Mac is using all of its RAM efficiently.
- Yellow: your Mac might eventually need more RAM.
- Red: your Mac needs more RAM.
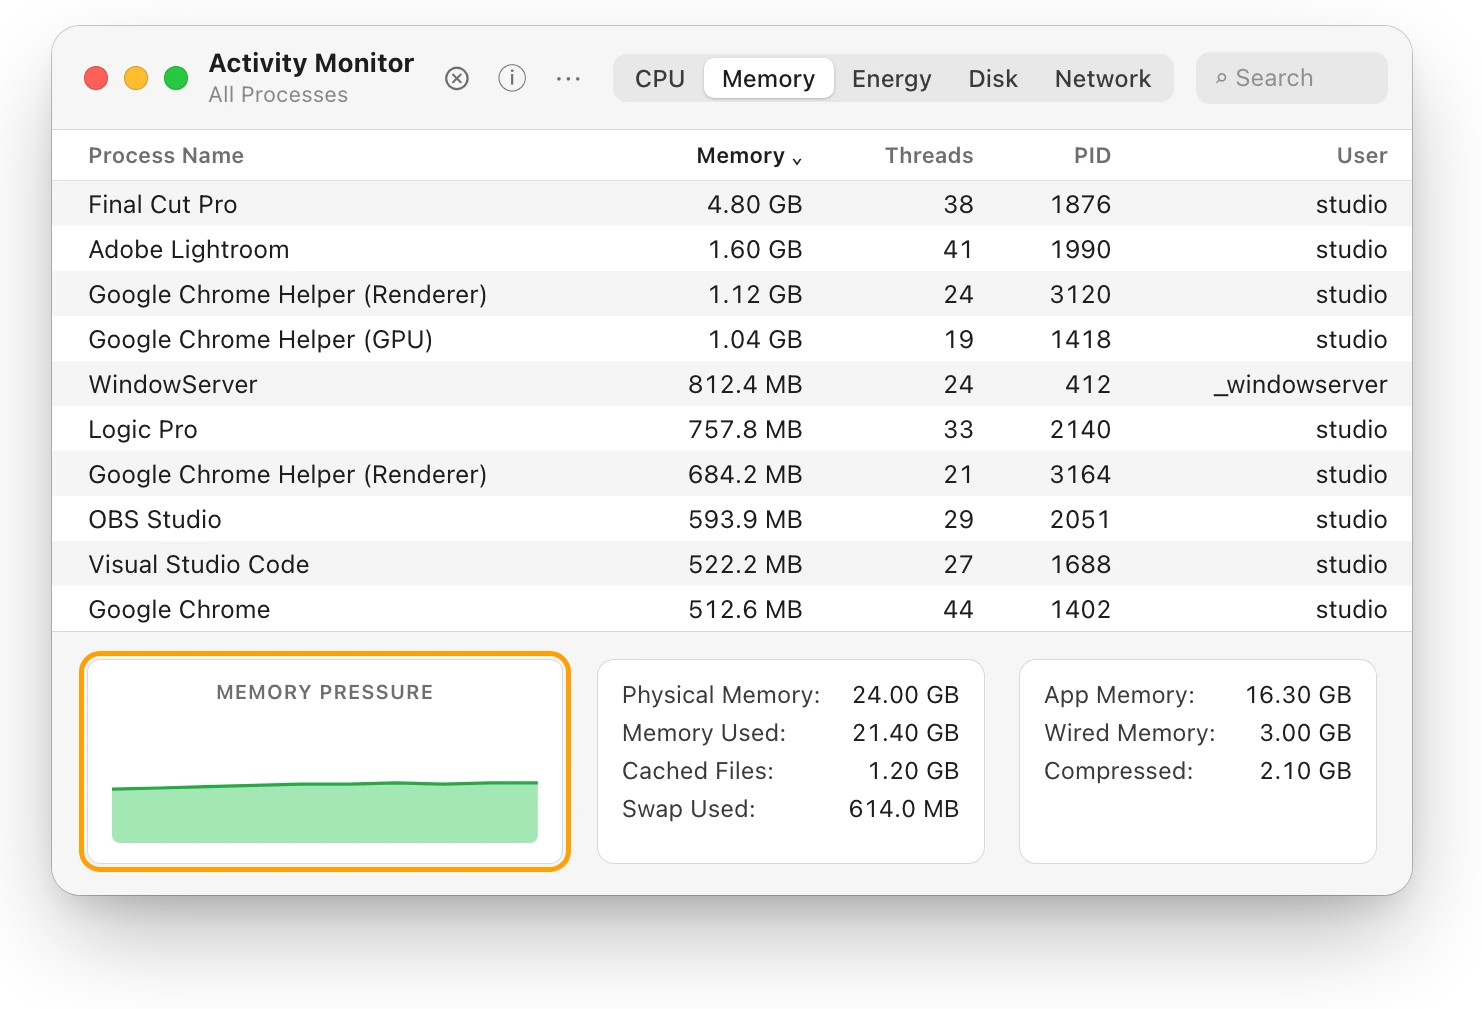
Apple says the graph is based on free memory, swap rate, wired memory and file-cached memory. It already takes into account what macOS can make room for, which is why it’s a better guide than the amount in use.
What do Memory Used, Cached Files, Compressed and Swap mean?
The numbers beside the graph explain where the memory is. Here they are with the values from the picture above:
| In Activity Monitor | What it means | Above |
|---|---|---|
| Physical Memory | The RAM installed in your Mac | 24.00 GB |
| Memory Used | The RAM in use now, made up of the three below it | 21.40 GB |
| App Memory | Memory used by apps | 16.30 GB |
| Wired Memory | Memory macOS needs to operate; it can’t be moved out of RAM or used by other apps | 3.00 GB |
| Compressed | Memory macOS has compressed to free up room | 2.10 GB |
| Cached Files | Files macOS keeps in unused memory to speed things up, until the space is needed | 1.20 GB |
| Swap Used | Space on the startup disk that macOS uses to move things in and out of RAM | 614.0 MB |
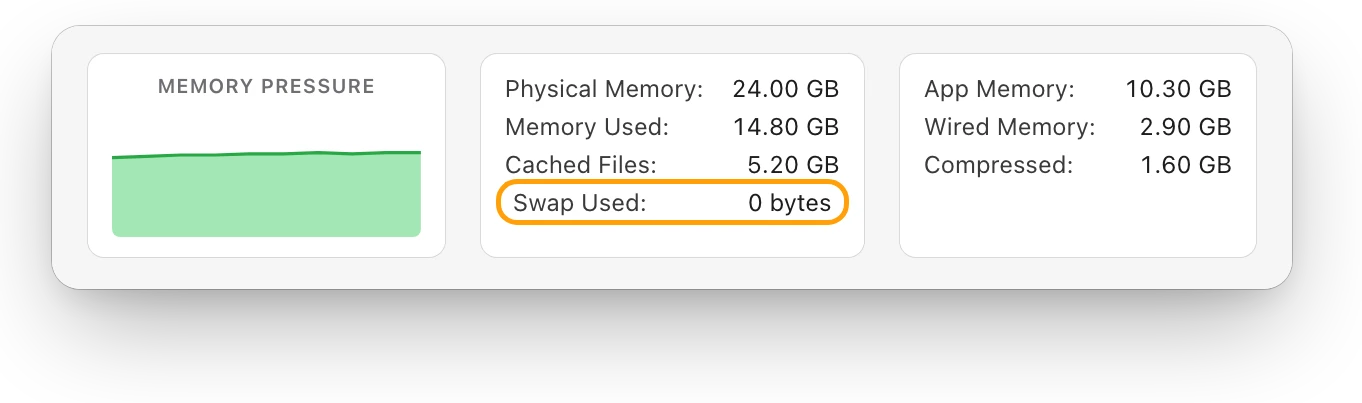
Cached Files is shown apart from Memory Used. It’s memory macOS lends to files you may open again, and it gets overwritten when something else needs the room. A little swap is normal too. Swap that keeps growing while memory pressure is yellow or red means your Mac is short of memory for what’s open.
What should I do if memory pressure is yellow or red?
Yellow or red means your Mac is short of memory for what’s open. Compressed memory and swap grow as macOS makes room.
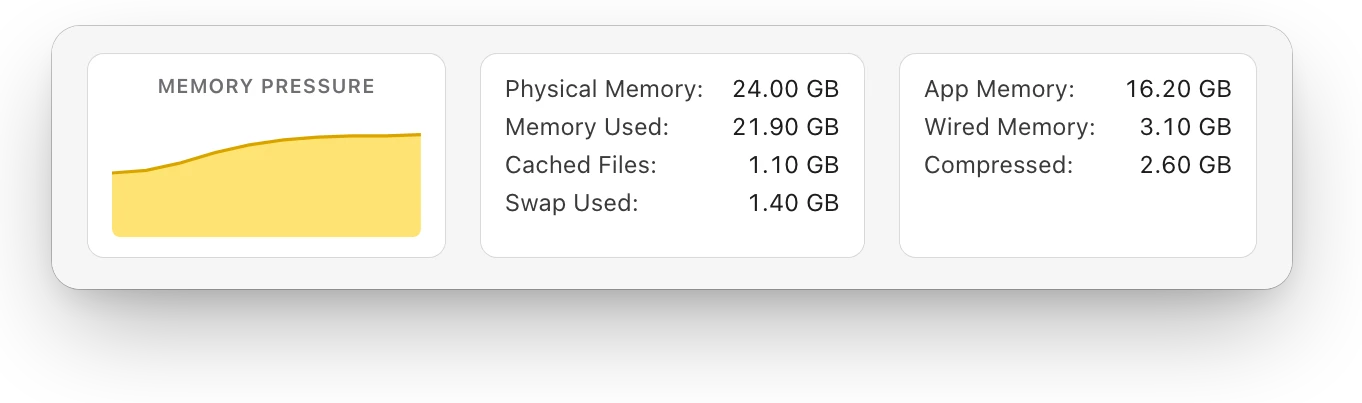
- In Activity Monitor’s Memory tab, click the Memory column heading to sort the list, largest first.
- Quit the apps you aren’t using, from their own menus. Save your work first.
- If an app isn’t responding, select it, click the Stop button at the top of the window, then choose Quit. Choose Force Quit only if Quit doesn’t work, because unsaved work in that app is lost.
- Close browser tabs you’re done with.
- Watch the graph for a minute. If it turns green again, that was enough.
If memory pressure stays yellow or red with only the apps you need, your Mac needs more memory for that work. Is 8 GB or 16 GB of RAM enough for your Mac? helps you choose how much for your next Mac.
Questions people also ask
Is it bad that my Mac’s memory is almost full?
No, as long as memory pressure stays green. macOS uses spare memory on purpose, for apps and for files you may need again.
Does freeing up RAM make a Mac faster?
Not while memory pressure is green. Apple says free memory doesn’t necessarily mean better performance.
What is wired memory on a Mac?
Wired Memory is memory macOS needs to operate. It can’t be cached or moved out of RAM, so other apps can’t use it.
Scope for Mac · Free, coming to the Mac App Store
How Scope helps
Scope is a free Mac menu bar app that shows how much RAM is in use beside macOS’s memory pressure, in plain words: Normal, Warning or Critical. It saves opening Activity Monitor to tell a Mac that’s busy from one that’s running short.
In your menu bar
RAM reads 89% in the menu bar here, and the panel says what that means.

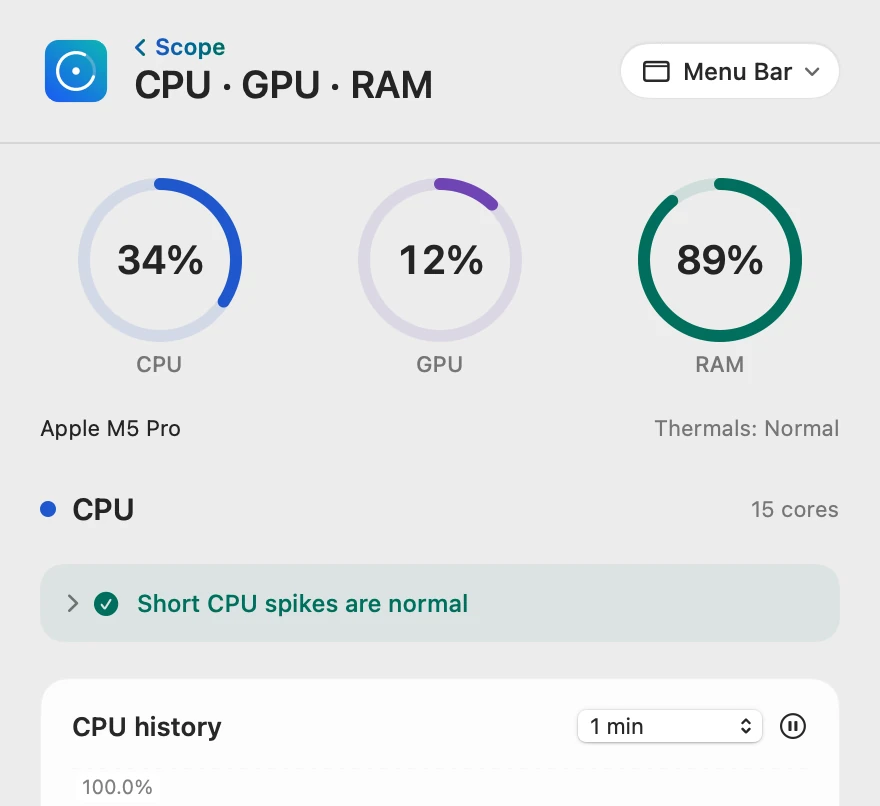
Pressure beside the number
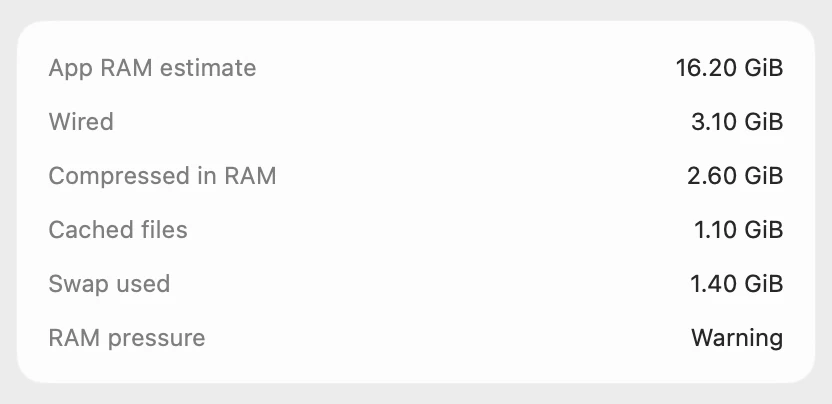
Scope’s RAM pressure is macOS’s own memory pressure in words, which Activity Monitor shows as green, yellow or red. Scope writes GiB where Activity Monitor writes GB; for memory they’re the same measure, so 21.40 matches.
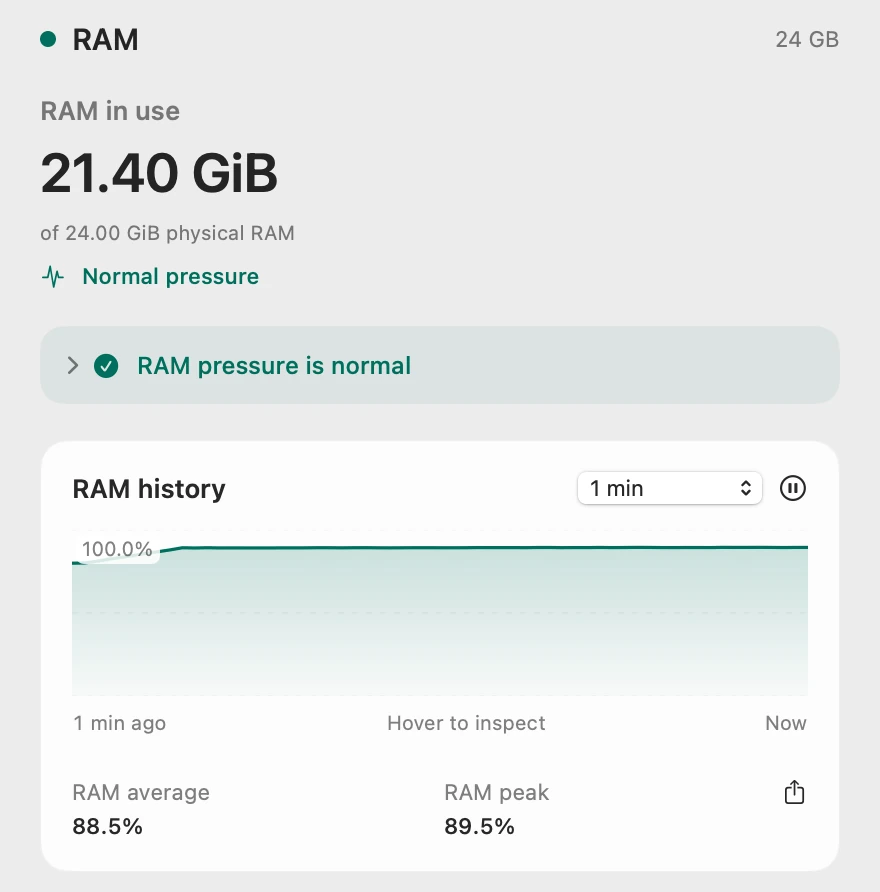
When memory runs short
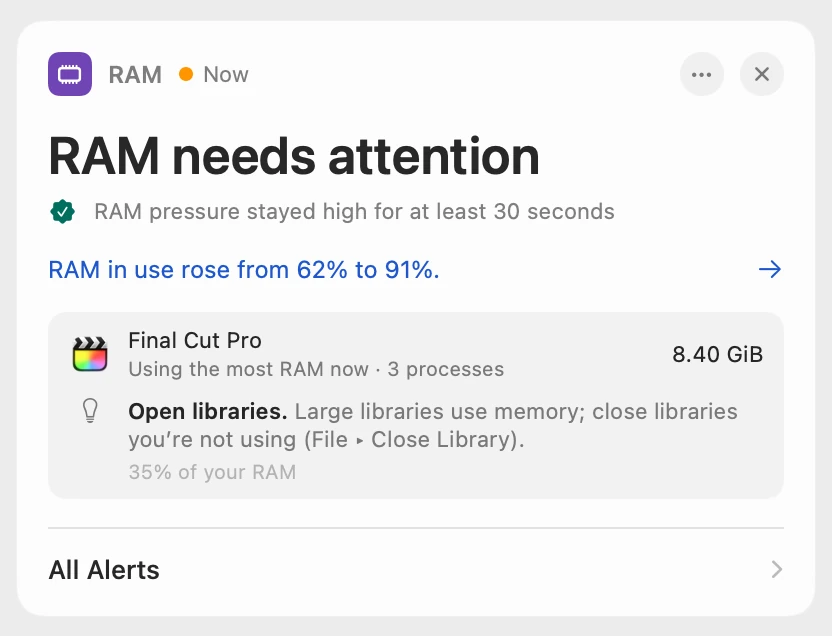
These are the same numbers as Activity Monitor’s yellow moment above, in one card, with RAM pressure on its last line.
Told when it really runs short
When RAM pressure stays high for 30 seconds, memory is really running short, and Scope says “RAM needs attention”. Scope Free shows the alert when you open Scope. A second alert covers RAM in use over 80% for a minute, also in Scope Free, and never appears beside a RAM pressure alert. Scope Pro adds a red + on its menu bar icon, names the app using the most RAM, and adds a tip.
Scope shows and explains. It doesn’t free memory, quit apps or change anything on your Mac.
Try it here
The real Scope, working, right in this page.
Click any item in the menu bar, or a card inside, as you would on your Mac.
Scope Pro Every menu bar item is shown here. Scope Free keeps one whole item of your choice, with every reading inside.
See how your own Mac’s memory is doing.
Keep reading
Guide · Slow Mac
Why is my Mac slow? How to find the cause
A slow Mac is usually a busy app, too little memory, a nearly full disk or heat. Here’s how to see which one with macOS’s own tools.
Slow Mac
Is 8 GB or 16 GB of RAM enough for your Mac?
Memory pressure tells you if your Mac has enough RAM: green on your busiest day means it does. Here’s how to check, and what to buy next.
Slow Mac
What is swap on a Mac, and when should you worry?
Swap is startup-disk space macOS uses to make room in RAM. Some is normal; it matters when memory pressure is yellow or red and Swap Used keeps growing.
Slow Mac
Why is Chrome using so much memory on a Mac?
Chrome runs tabs and parts of the browser as separate processes, so its memory adds up. Here’s how to see it on a Mac, and when it matters.
Sources
- Apple Support: View memory usage in Activity Monitor on Mac
- Apple Support: Check if your Mac needs more RAM in Activity Monitor
- Apple Support: View information about Mac processes in Activity Monitor
- Apple Support: Quit a process in Activity Monitor on Mac
Last checked October 18, 2026. Readings, apps and files in the pictures are from a made-up Mac.