Why is Chrome using so much memory on a Mac?
Google Chrome uses a lot of memory on a Mac because it runs most tabs, and parts of the browser itself, as separate processes, and each one needs memory of its own. In Activity Monitor they appear as Google Chrome Helper, Google Chrome Helper (Renderer) and Google Chrome Helper (GPU). That’s fine while memory pressure stays green. If it turns yellow or red, close tabs you’re done with, check Chrome’s Task Manager, or turn on Memory Saver.
Why does Chrome use so much memory?
Chrome splits its work into separate processes on purpose. According to the Chromium project’s design notes, the main browser process runs the browser’s interface and manages the others; web pages run in renderer processes, generally a new one for each tab or window; and graphics, networking and storage each get processes of their own.
The Chromium notes give two reasons. A page that crashes or hangs stays in its own process, so it doesn’t take the whole browser down with it, and for security, each renderer is limited in what it can reach on the rest of the system. With many tabs open, those processes and their memory add up.
What is Google Chrome Helper (Renderer)?
Google Chrome Helper (Renderer) is a Chrome process that runs web pages, so with several tabs open you’ll usually see several of them. Google Chrome Helper (GPU) runs Chrome’s GPU process, for graphics work, and plain Google Chrome Helper processes run other parts of the browser. To see how much memory they use:
- Open Activity Monitor. It’s in Applications > Utilities, or search for it with Spotlight.
- Click Memory, then click the Memory column heading to sort the list, largest first.
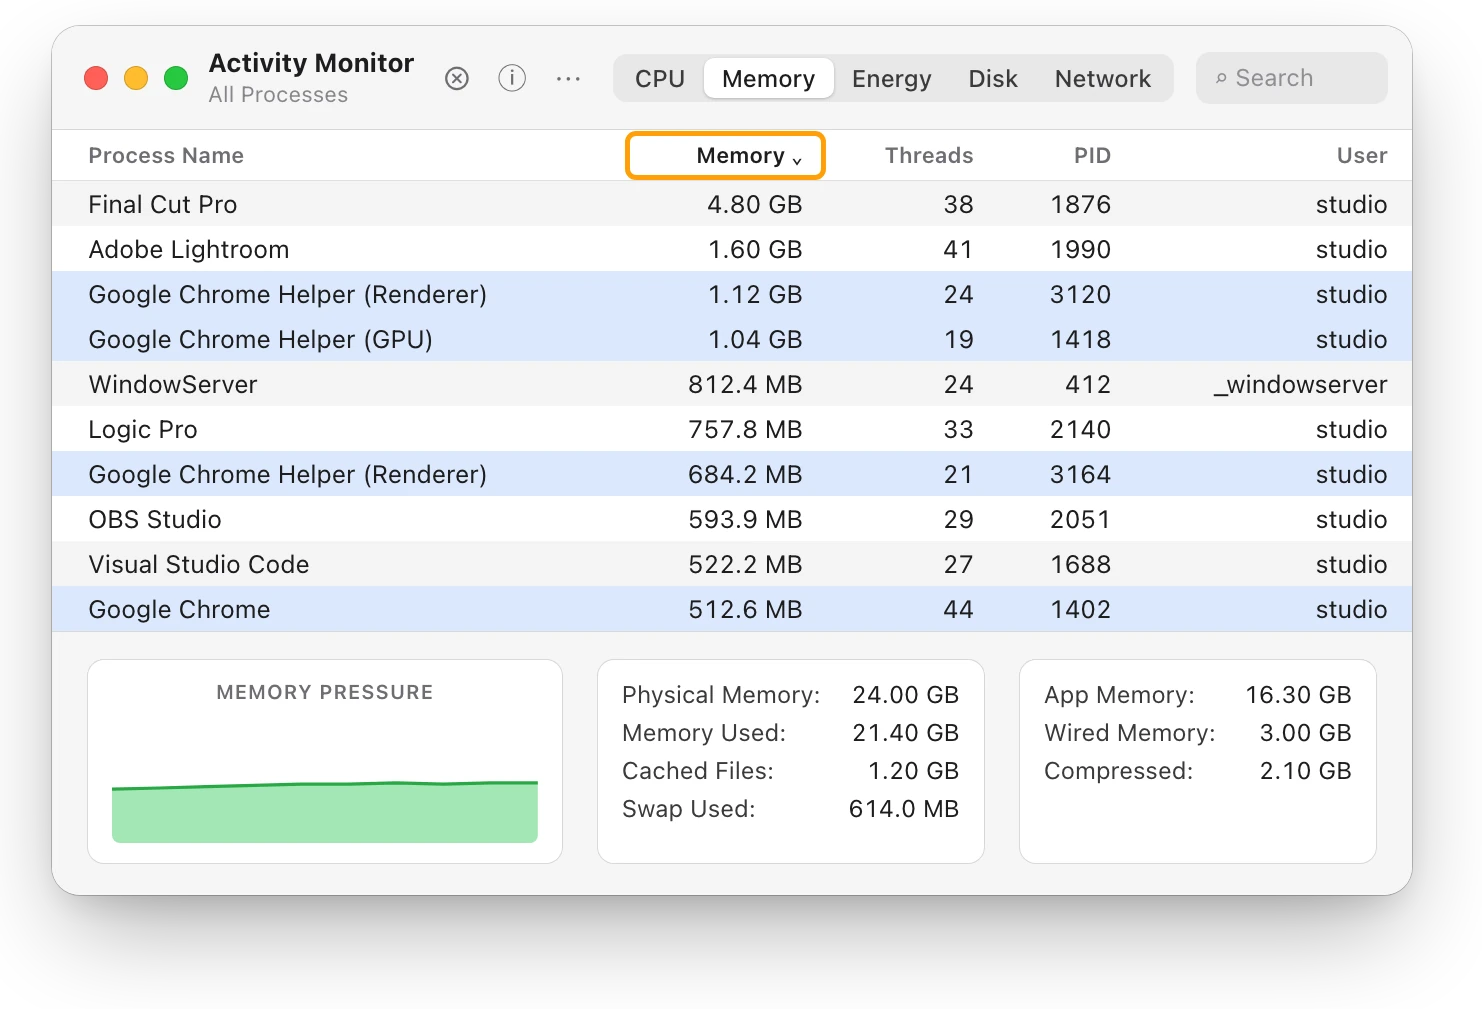
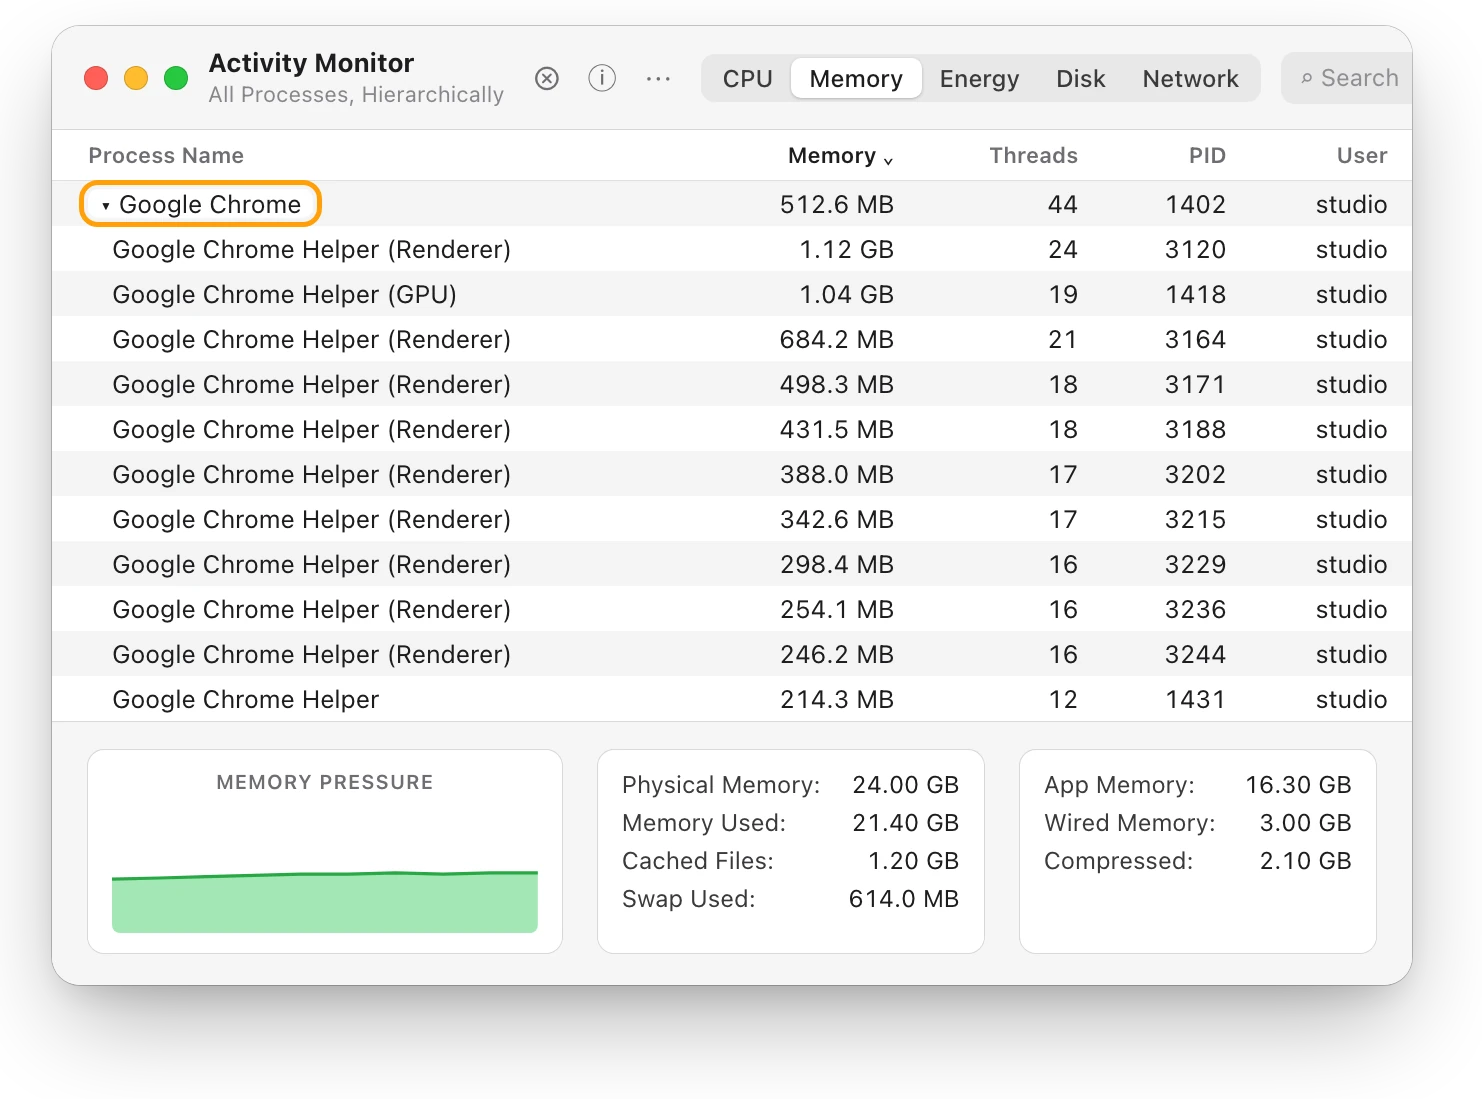
- To see them together, choose View > All Processes, Hierarchically. Activity Monitor then shows each process under the one that started it.
- Find Google Chrome and click the arrow beside it to show the processes it started.
How do I see which tab is using the most memory?
Chrome’s own Task Manager lists tabs and extensions by name.
- In Chrome, click More (the three dots) at the top right, then choose More tools > Task manager.
- Click the memory column heading to sort by memory use.
- Look for items you don’t need, including ones labeled “Background page”.
- Select one, then click End process. Any unsaved work in it is lost.
To see a tab’s memory without opening the Task Manager, go to Chrome’s Settings > Appearance and turn on “Show memory usage on tab hover preview card”. Hovering over a tab then shows how much memory it’s using.
How do I make Chrome use less memory?
- Close tabs you’re done with. Click a tab’s close button or press Command-W. If you close one by mistake, Command-Shift-T opens it again.
- Turn off extensions you don’t use. Click More > Extensions > Manage Extensions, then turn off or remove the extension.
- Turn on Memory Saver. Click More > Settings > Performance, turn on Memory Saver, and choose Moderate, Balanced or Maximum. Chrome then makes tabs you aren’t using inactive to free memory, and reloads each one when you go back to it.
- Keep Chrome up to date. Google lists updating Chrome first among its steps to speed it up.
Should I worry about Chrome’s memory use?
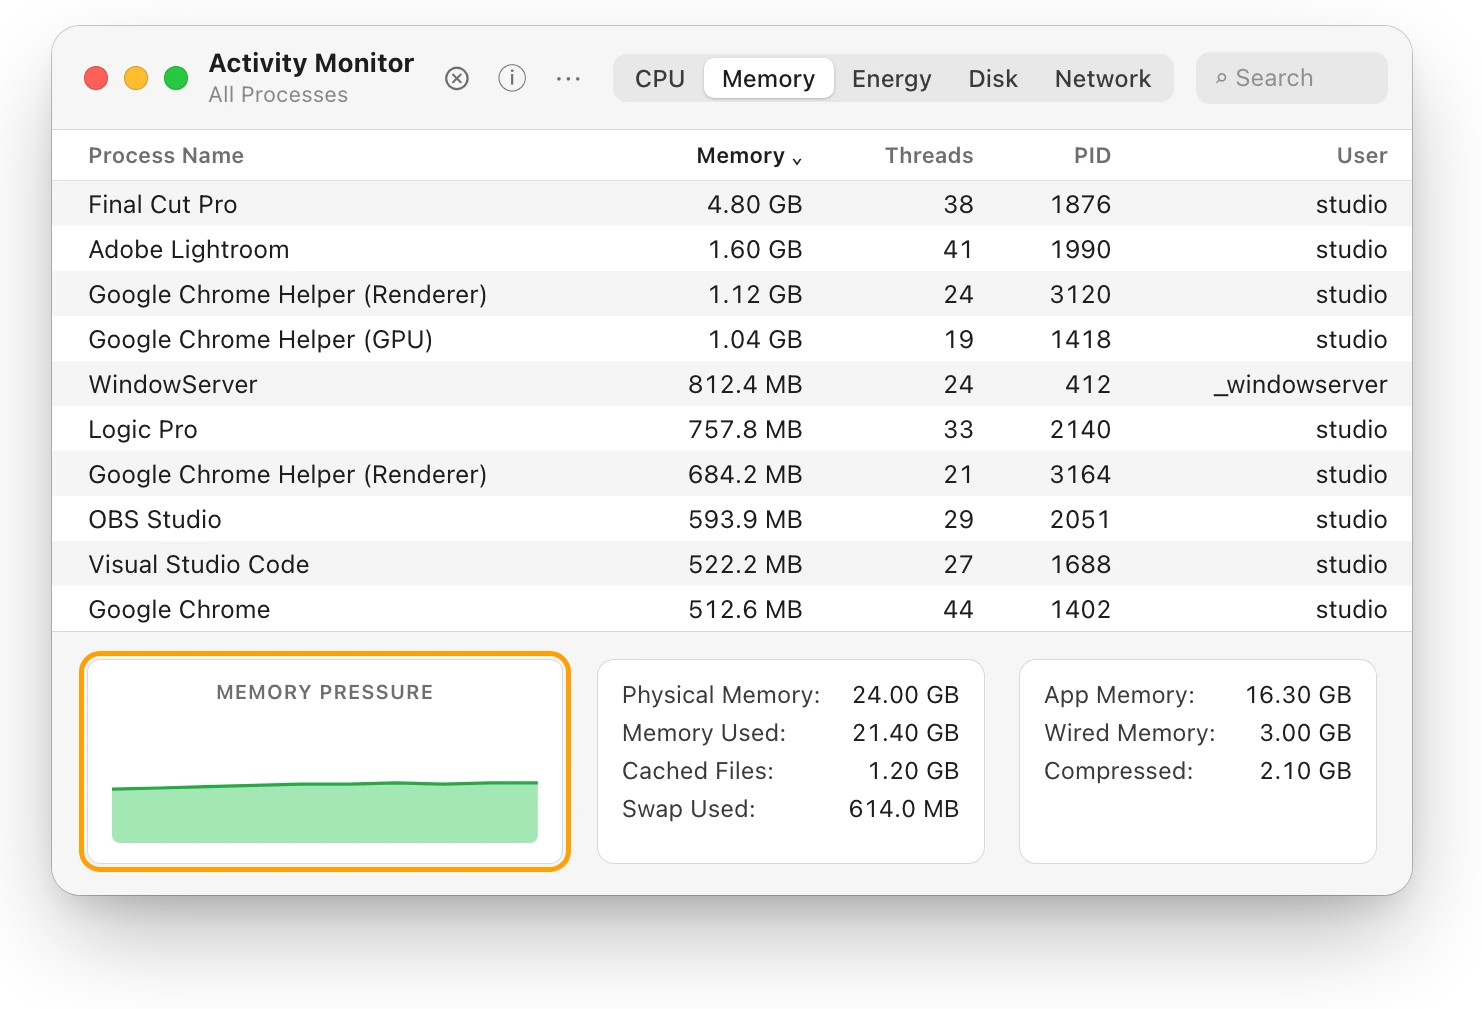
Only if memory pressure isn’t green. In Activity Monitor’s Memory tab, check the Memory Pressure graph at the bottom. Green means your Mac is using its memory efficiently, even with gigabytes held by Chrome. Yellow or red means your Mac is short of memory for what’s open, and Chrome’s tabs are a good place to start closing. Mac memory pressure: why high RAM use is often fine explains the graph.
Questions people also ask
Is it safe to quit Google Chrome Helper in Activity Monitor?
It’s easier to use Chrome’s Task Manager instead. It names the tab or extension behind each process, so you know what you’re closing. Ending a task loses any unsaved work in it either way.
Does Memory Saver close my tabs?
No. Memory Saver makes tabs you aren’t using inactive to free memory, and an inactive tab reloads automatically when you open it.
Why does Chrome show so many processes on a Mac?
Chrome runs web pages, graphics, networking and storage in separate processes, so one failing page doesn’t bring down the rest. Each open tab can add another renderer.
Scope for Mac · Free, coming to the Mac App Store
How Scope helps
Scope is a free Mac menu bar app that shows how much RAM is in use beside macOS’s memory pressure, and Scope Pro names the app using the most RAM, Google Chrome included, with all of its helper processes counted together. It saves adding up Chrome Helper rows in Activity Monitor to see what the browser holds.
In your menu bar

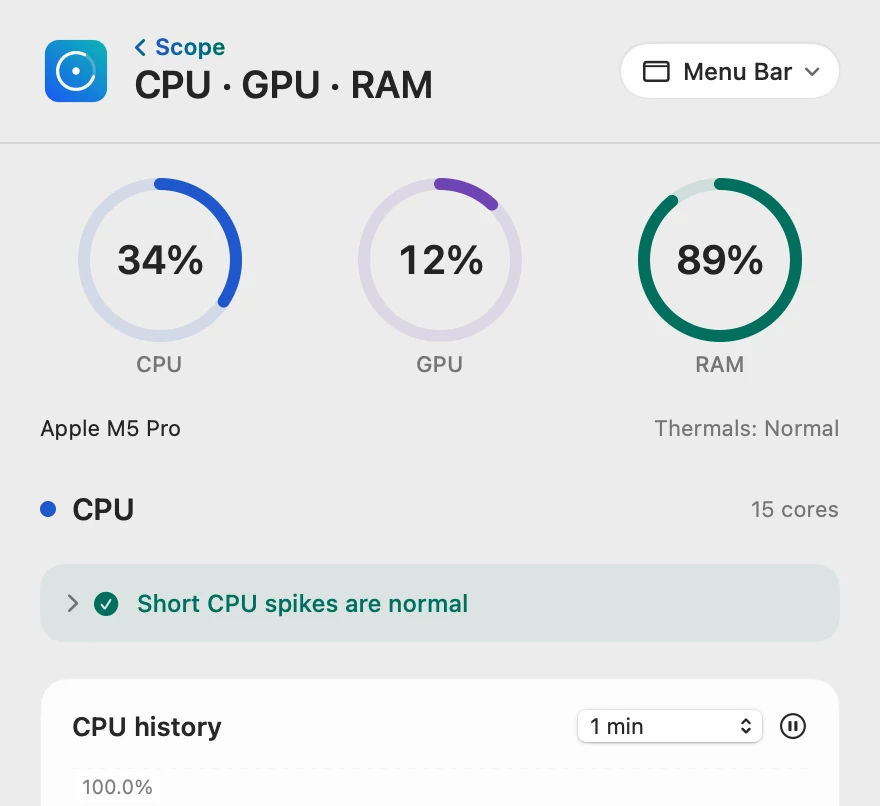
Memory pressure, not just the number
Normal pressure means everything open, Chrome’s tabs included, still fits. Scope writes GiB where Activity Monitor writes GB; for memory they’re the same measure.
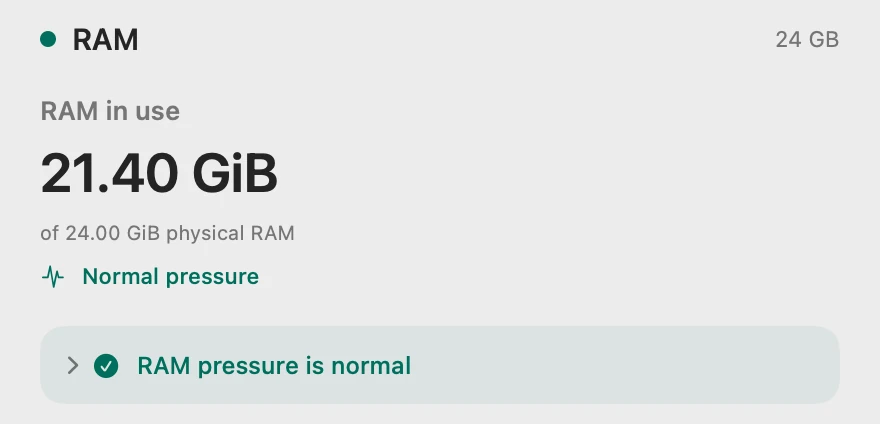
Chrome named, helpers counted
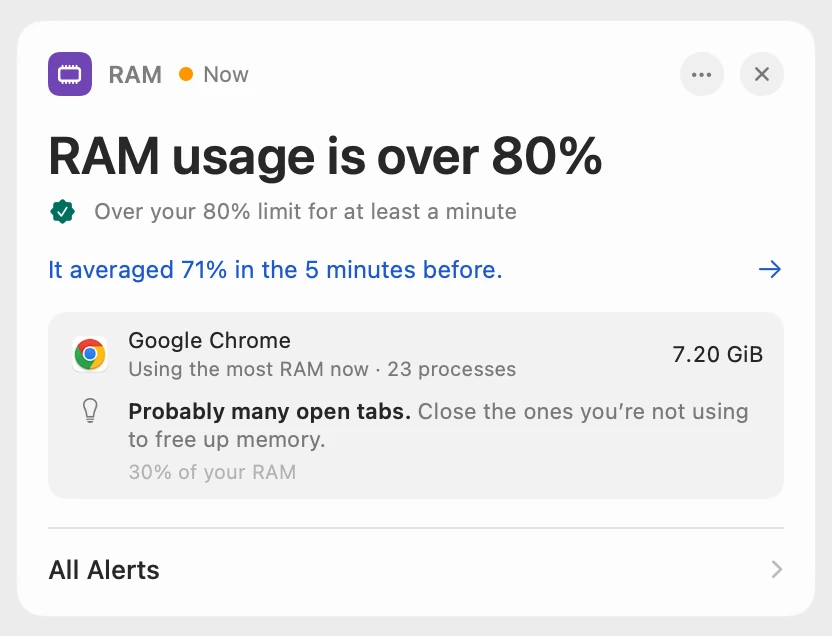
When RAM in use stays over 80% for a minute, Scope shows “RAM usage is over 80%” on its overview when you open it, in Scope Free too. Scope Pro adds a red + on its menu bar icon, names the app using the most RAM with every helper process counted toward it, and suggests closing the tabs you’re not using.
Scope shows and explains. It never closes tabs or quits apps for you.
Try it here
The real Scope, working, right in this page.
Click any item in the menu bar, or a card inside, as you would on your Mac.
Scope Pro Every menu bar item is shown here. Scope Free keeps one whole item of your choice, with every reading inside.
See what’s holding your own Mac’s memory.
Keep reading
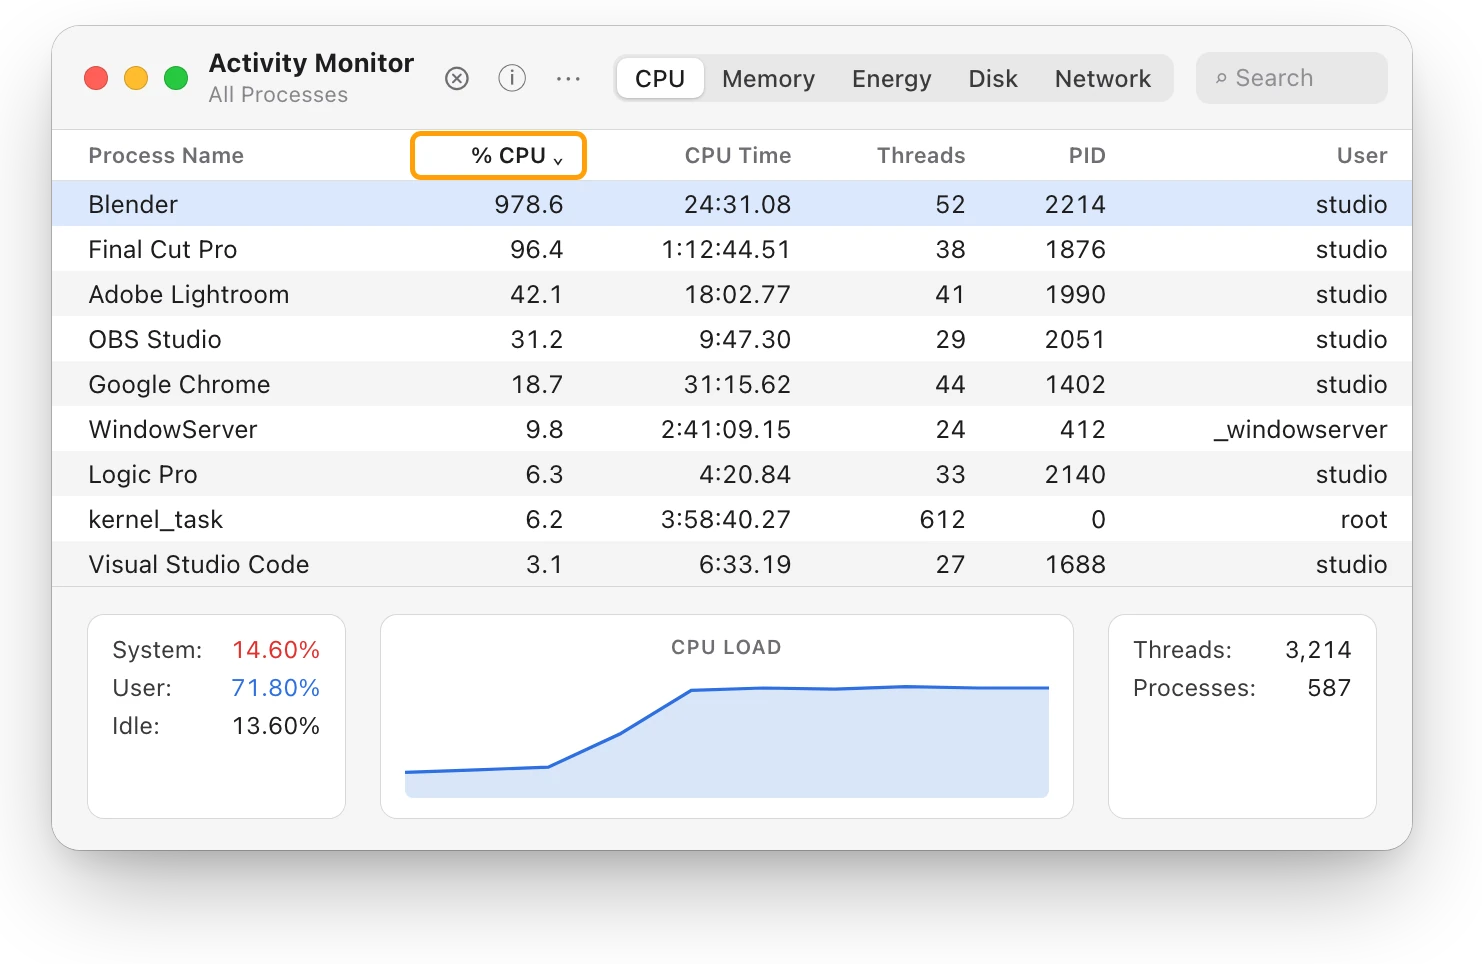
Guide · Slow Mac
Why is my Mac slow? How to find the cause
A slow Mac is usually a busy app, too little memory, a nearly full disk or heat. Here’s how to see which one with macOS’s own tools.
Slow Mac
Mac memory pressure: why high RAM use is often fine
Memory pressure, not RAM in use, shows if your Mac has enough memory. Green is fine even when RAM is nearly full; yellow or red means it’s running short.
Slow Mac
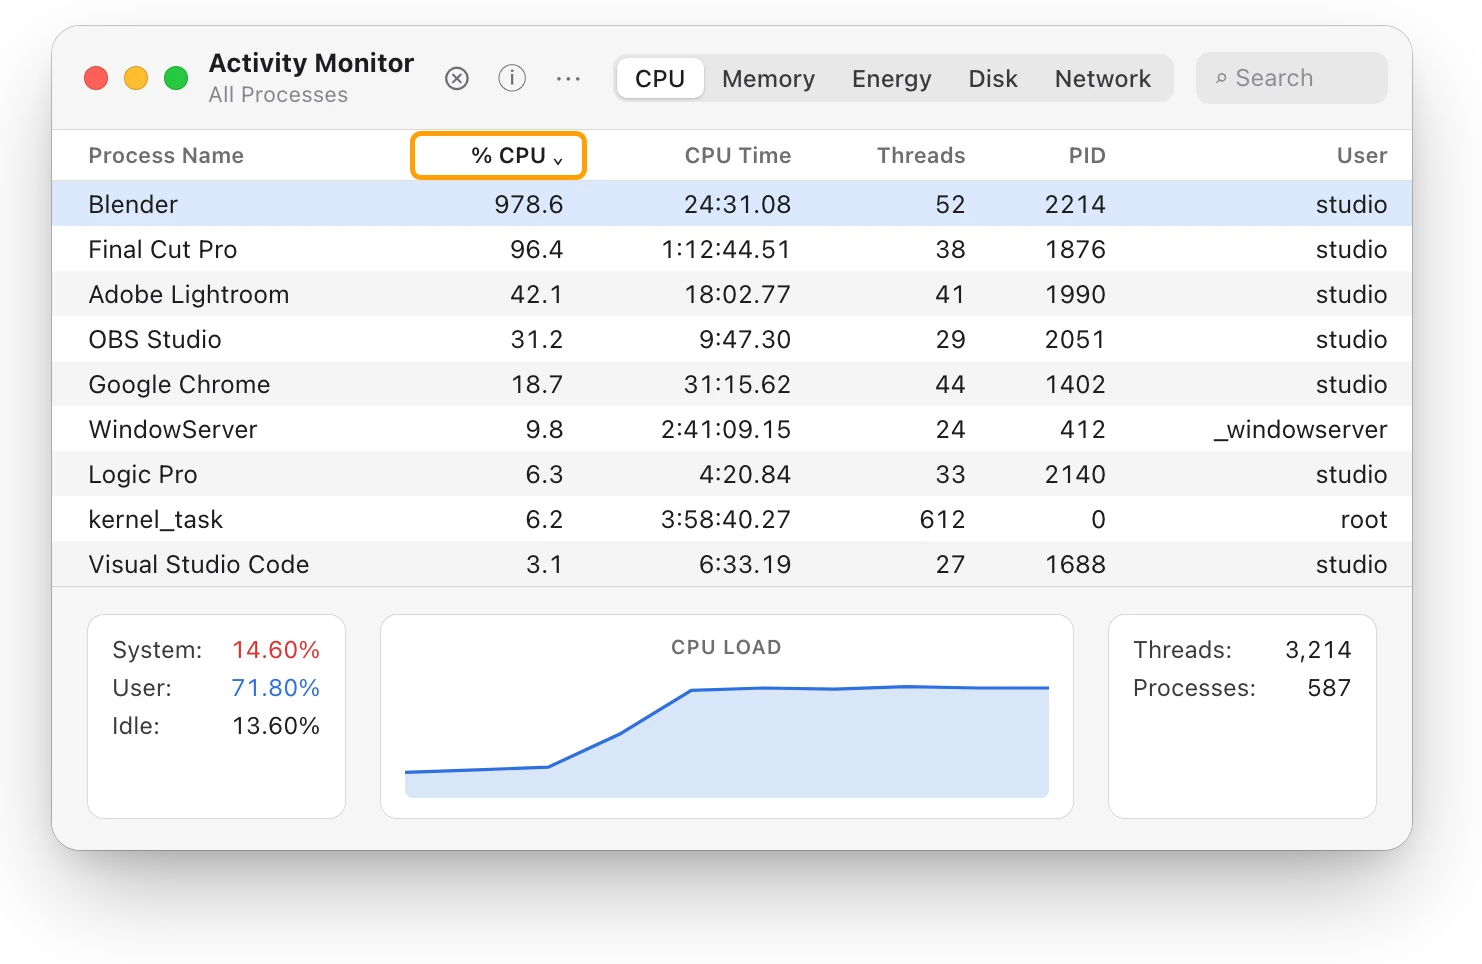
Which app is slowing down my Mac? How to find it
Activity Monitor shows which app is slowing your Mac: sort by % CPU, then by Memory. Here’s how to read the lists, and what to do next.
Slow Mac
Is 8 GB or 16 GB of RAM enough for your Mac?
Memory pressure tells you if your Mac has enough RAM: green on your busiest day means it does. Here’s how to check, and what to buy next.
Sources
- Google Chrome Help: Speed up Google Chrome
- Google Chrome Help: Personalize Chrome performance
- Google Chrome Help: Manage tabs in Chrome
- The Chromium Projects: Multi-process Architecture
- Chromium source: Mac helper processes (mac_helpers.gni)
- Apple Support: View information about Mac processes in Activity Monitor
- Apple Support: Check if your Mac needs more RAM in Activity Monitor
Last checked October 18, 2026. Readings, apps and files in the pictures are from a made-up Mac.