Spinning wheel on Mac? What it means and what to do
The spinning wheel on a Mac, which Apple calls the wait cursor, appears when an app is delayed by more than a few seconds. If it spins over one app, wait a moment, then press Option-Command-Esc to force quit that app. If it spins in every app, Activity Monitor shows whether the processor, memory or a full disk is the cause.
What is the spinning wheel on a Mac called?
People call it the spinning beachball, the rainbow wheel or the pinwheel. Apple calls it the wait cursor, and says it appears when a delay of more than a few seconds occurs. It means an app is busy and can’t respond to you yet. Often it stops on its own once the work is done.
Where you see it tells you where to look:
| Where the wheel spins | What it usually means | What to do |
|---|---|---|
| Over one app | That app is busy or stuck | Wait, then quit or force quit it |
| In every app | The processor is busy, memory is short or the disk is nearly full | Check Activity Monitor and Storage |
| Right after a macOS update | Spotlight may be indexing your Mac again | Keep your Mac on power and give it time |
| Soon after every login | Software that opens at startup | Test in safe mode |
| Still there after all of this | Possibly the disk or other hardware | Disk Utility, then Apple Diagnostics |
How do I stop the spinning wheel in one app?
Give the app a moment first: an export, a large file or a slow download can keep it busy for a while. If the wheel doesn’t stop:
- Try to quit the app normally: press Command-Q, or choose Quit from the app’s menu in the menu bar. That lets it save your work.
- If it won’t quit, press Option, Command and Esc together, or choose Apple menu > Force Quit.
- In the Force Quit window, select the app that isn’t responding.
- Click Force Quit. Changes you haven’t saved in that app may be lost.
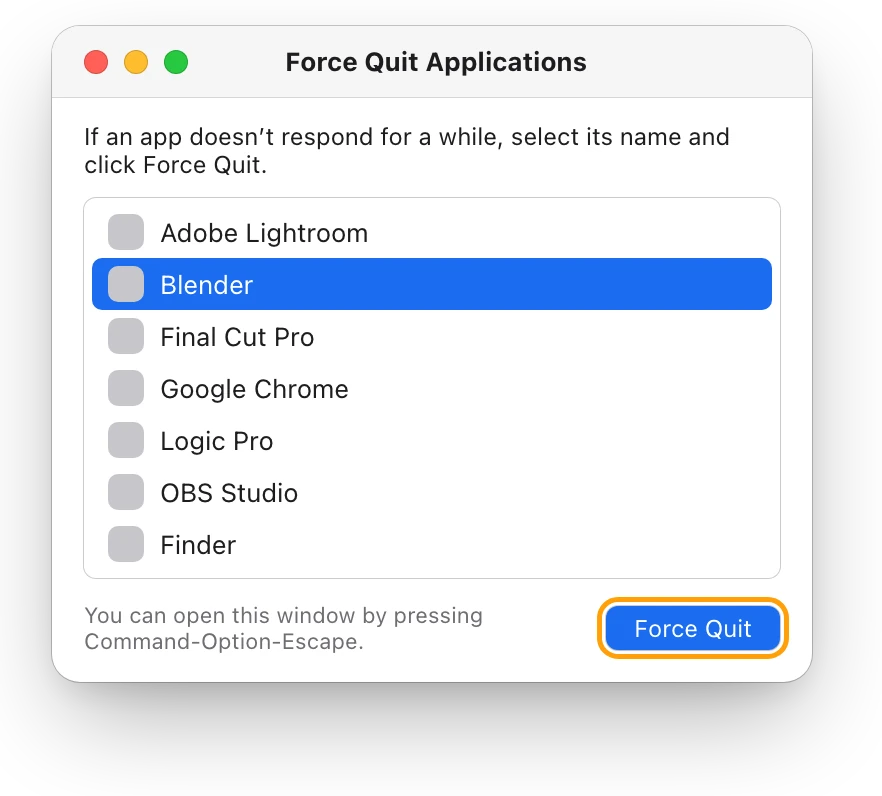
If the Finder is the one spinning, select Finder in the Force Quit window and click Relaunch: the Finder is always open, so it reopens instead. Task Manager on a Mac: how to open it shows the other ways to quit an app, including from Activity Monitor.
Why does the spinning wheel show up in every app?
When every app spins, your whole Mac is short of something: processor time, memory or disk space. Activity Monitor shows the first two.
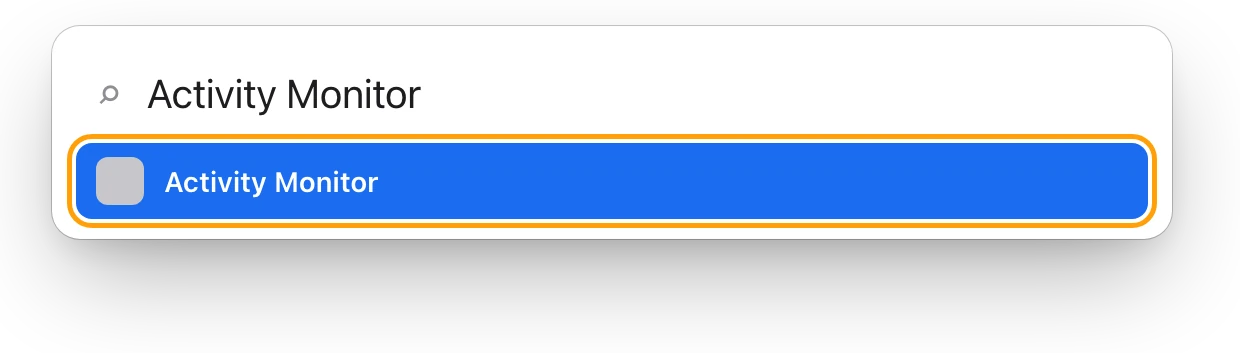
- Open Activity Monitor: press Command–Space bar, type Activity Monitor, then press Return.
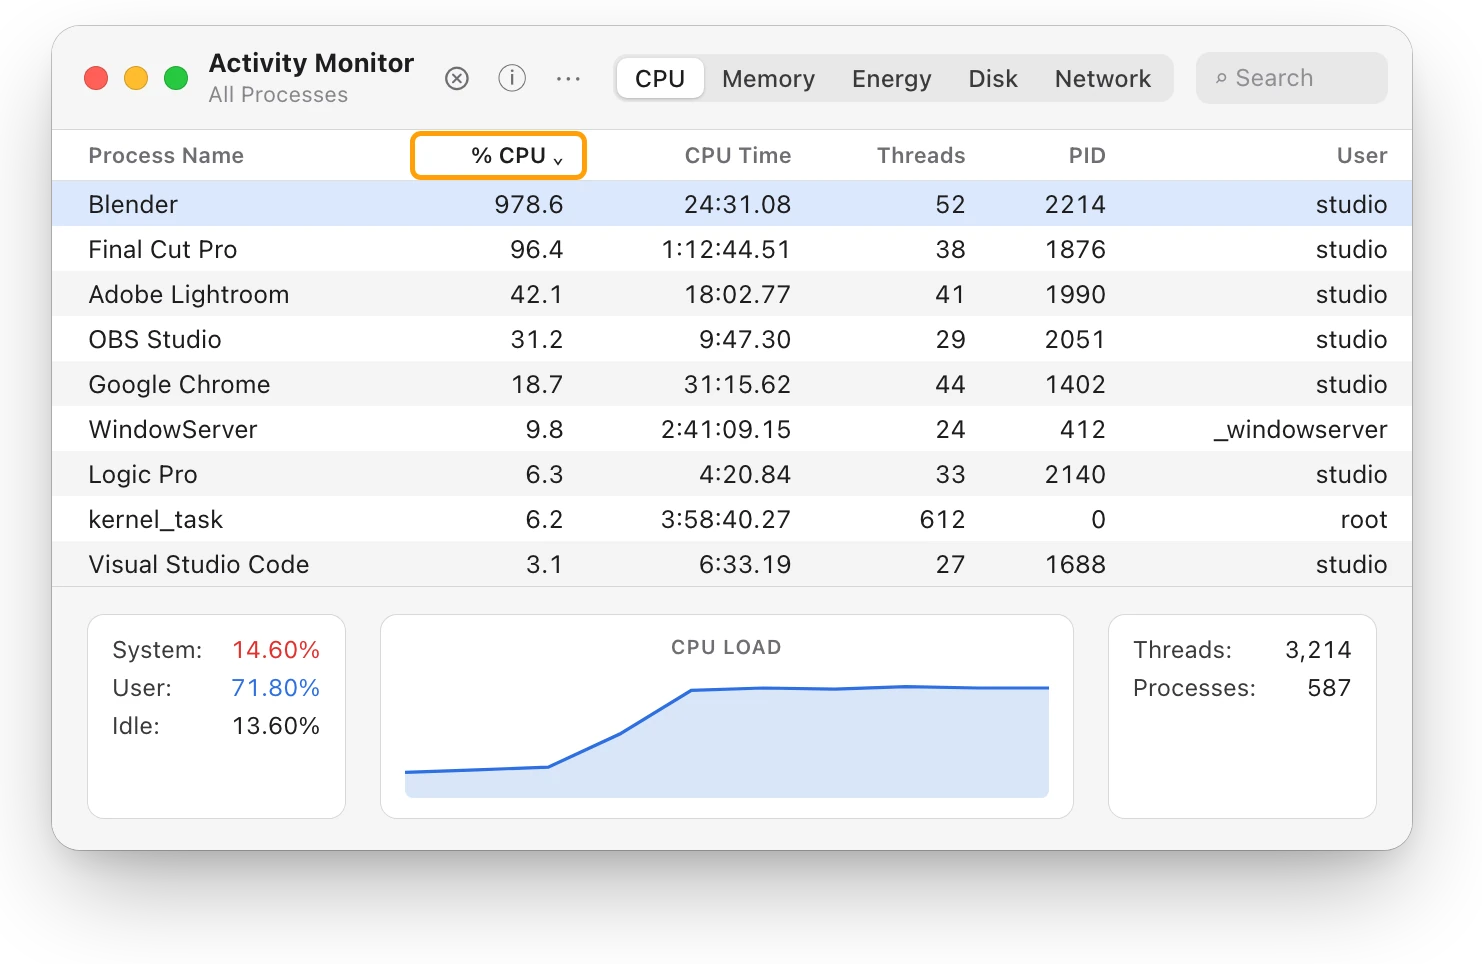
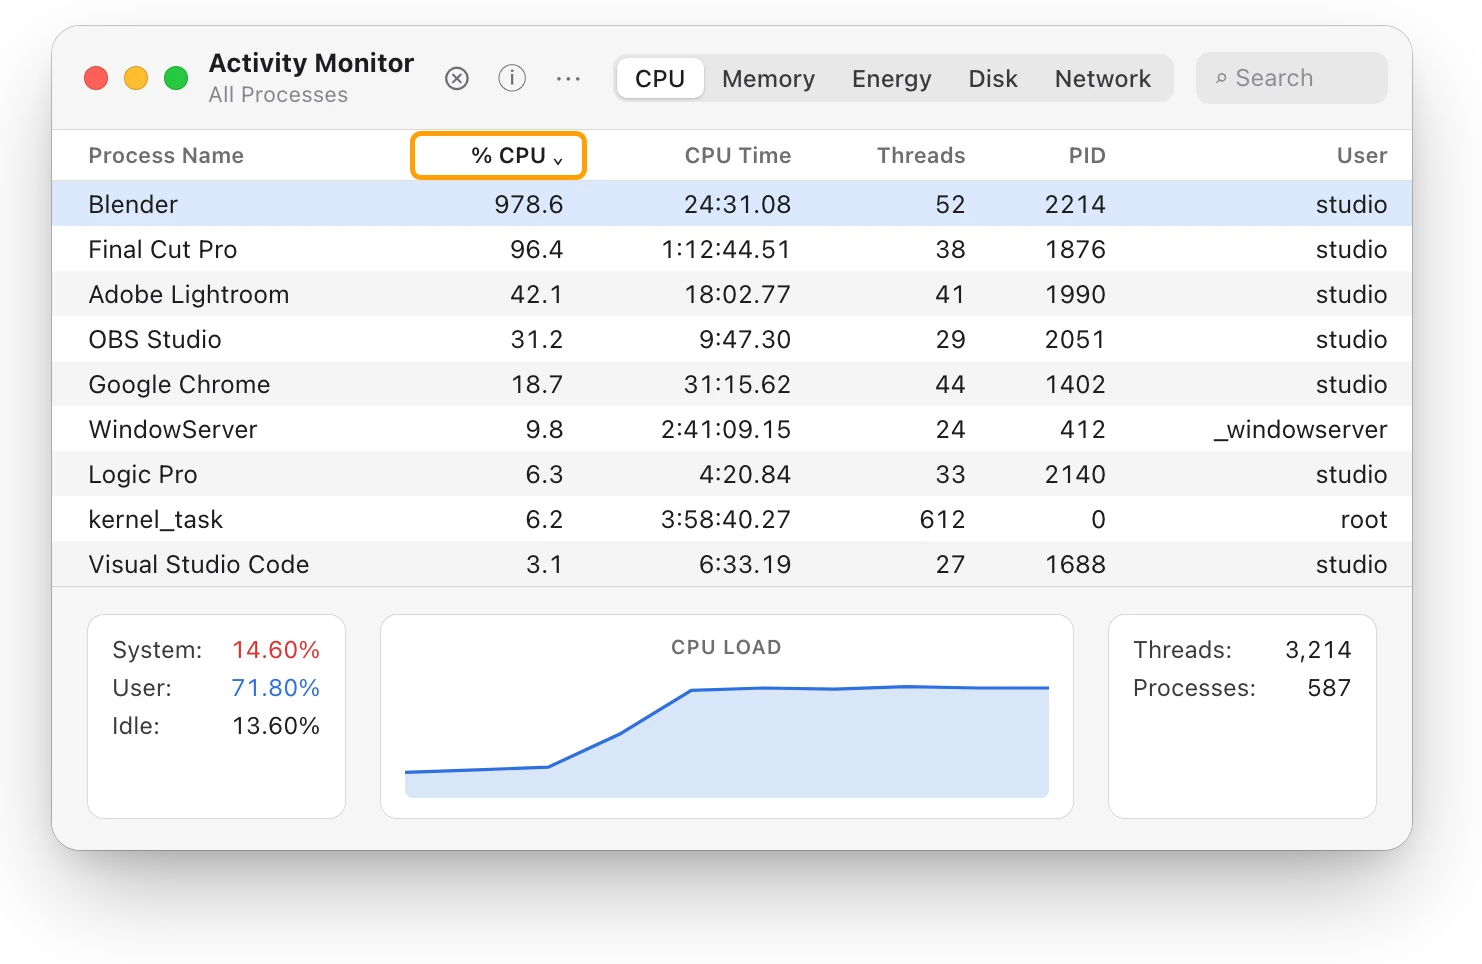
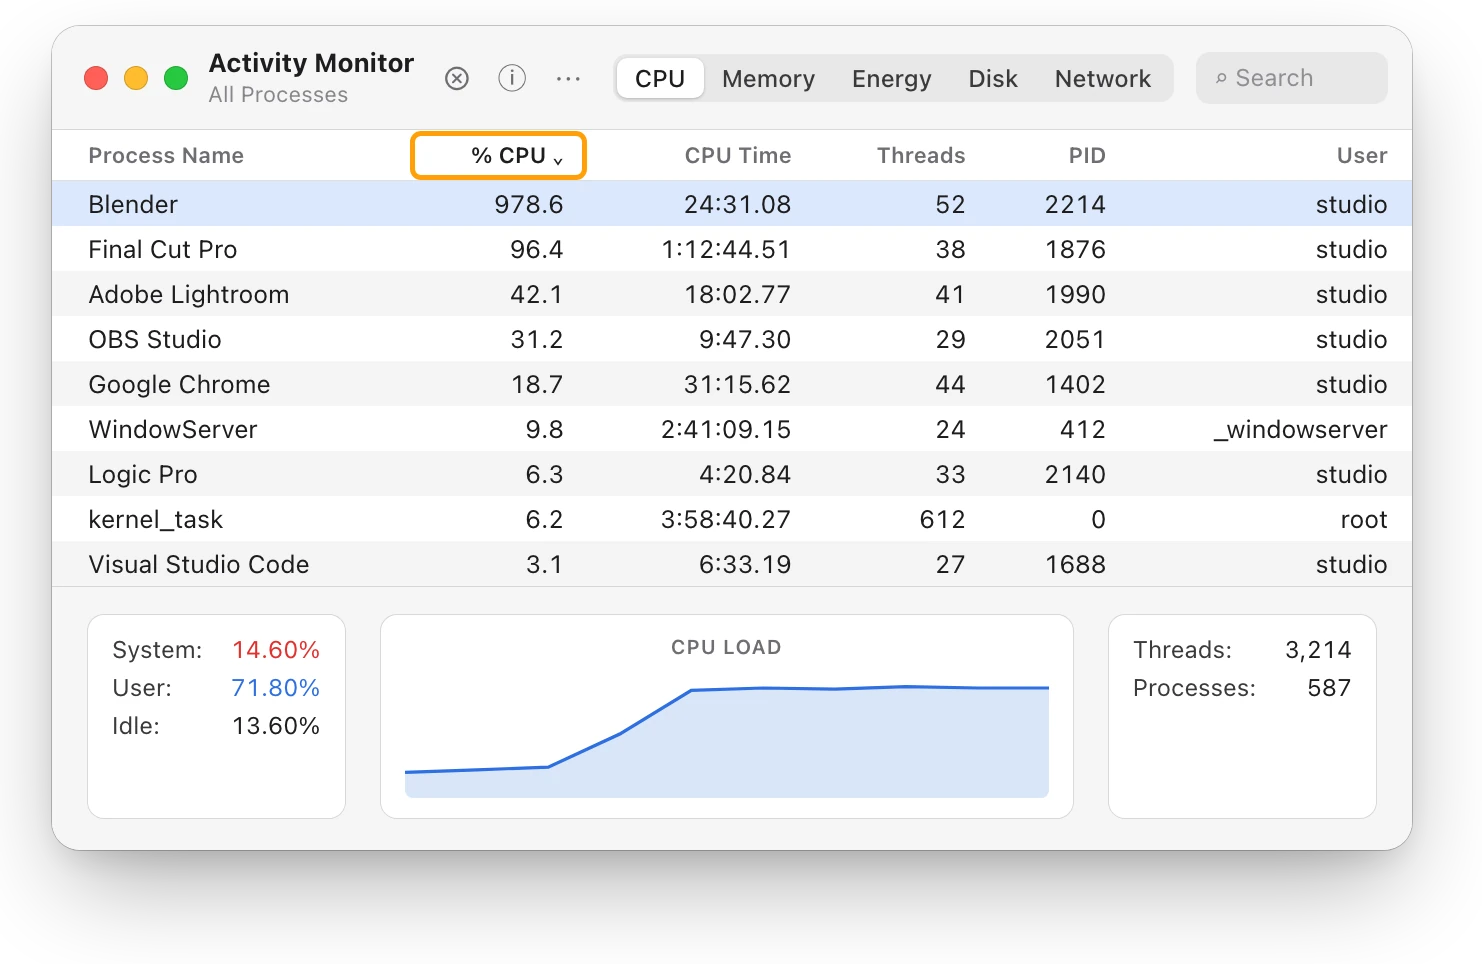
- Click CPU, then click the % CPU column heading to sort the list, busiest first. An app that stays at the top for minutes, not seconds, is the one keeping your Mac busy.
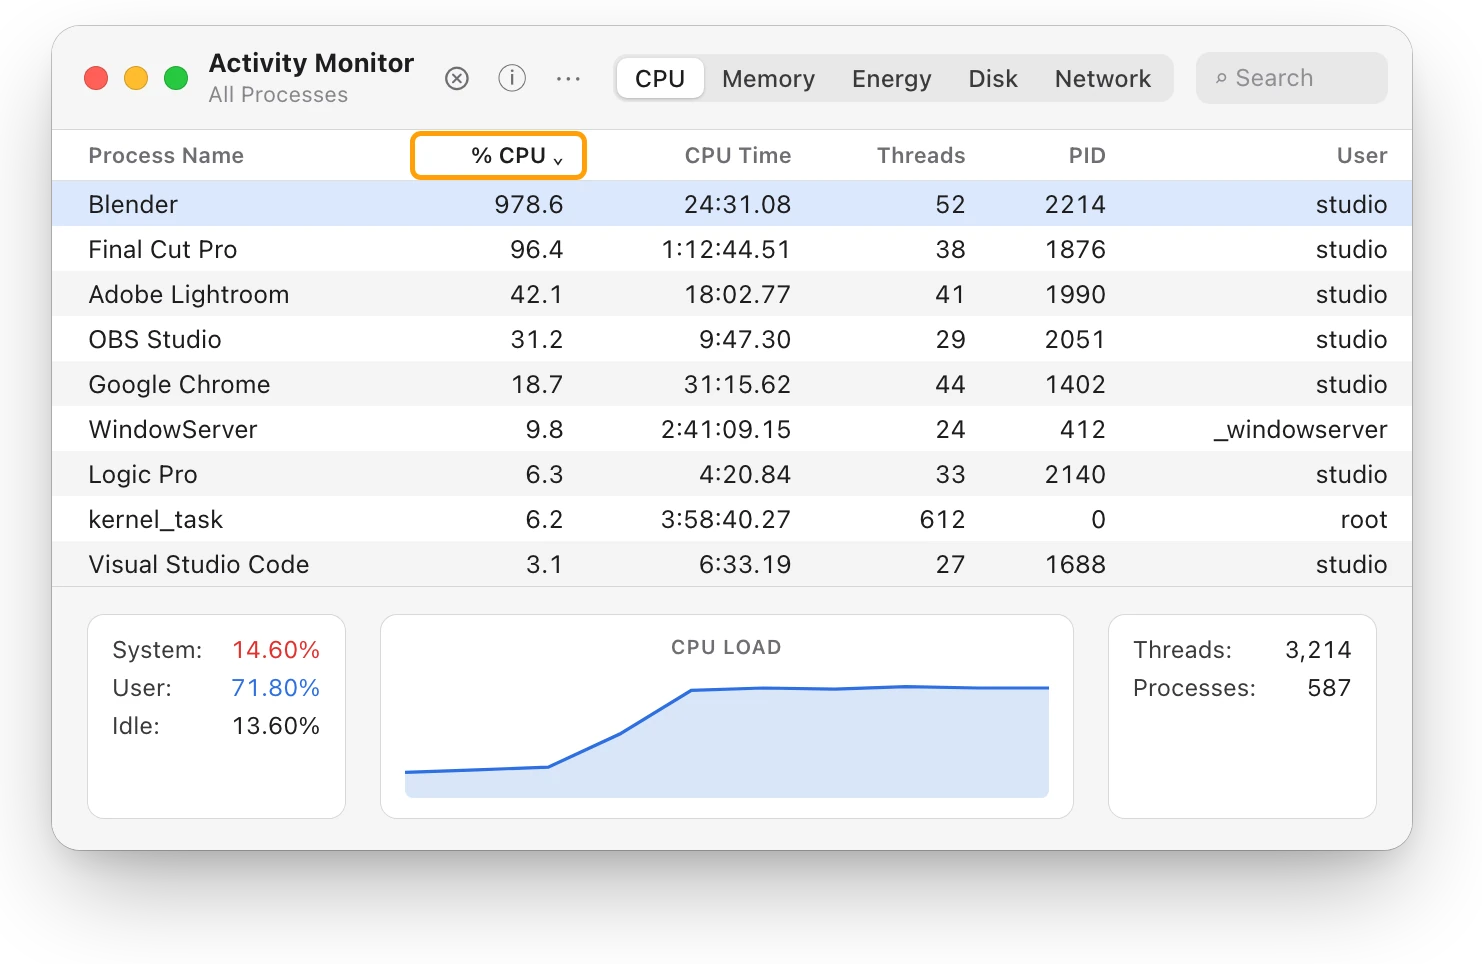
Activity Monitor counts each processor core as 100%, so this 15-core Mac can show up to 1,500%. Idle at the bottom, 13.60% here, is the share of the processor left over.
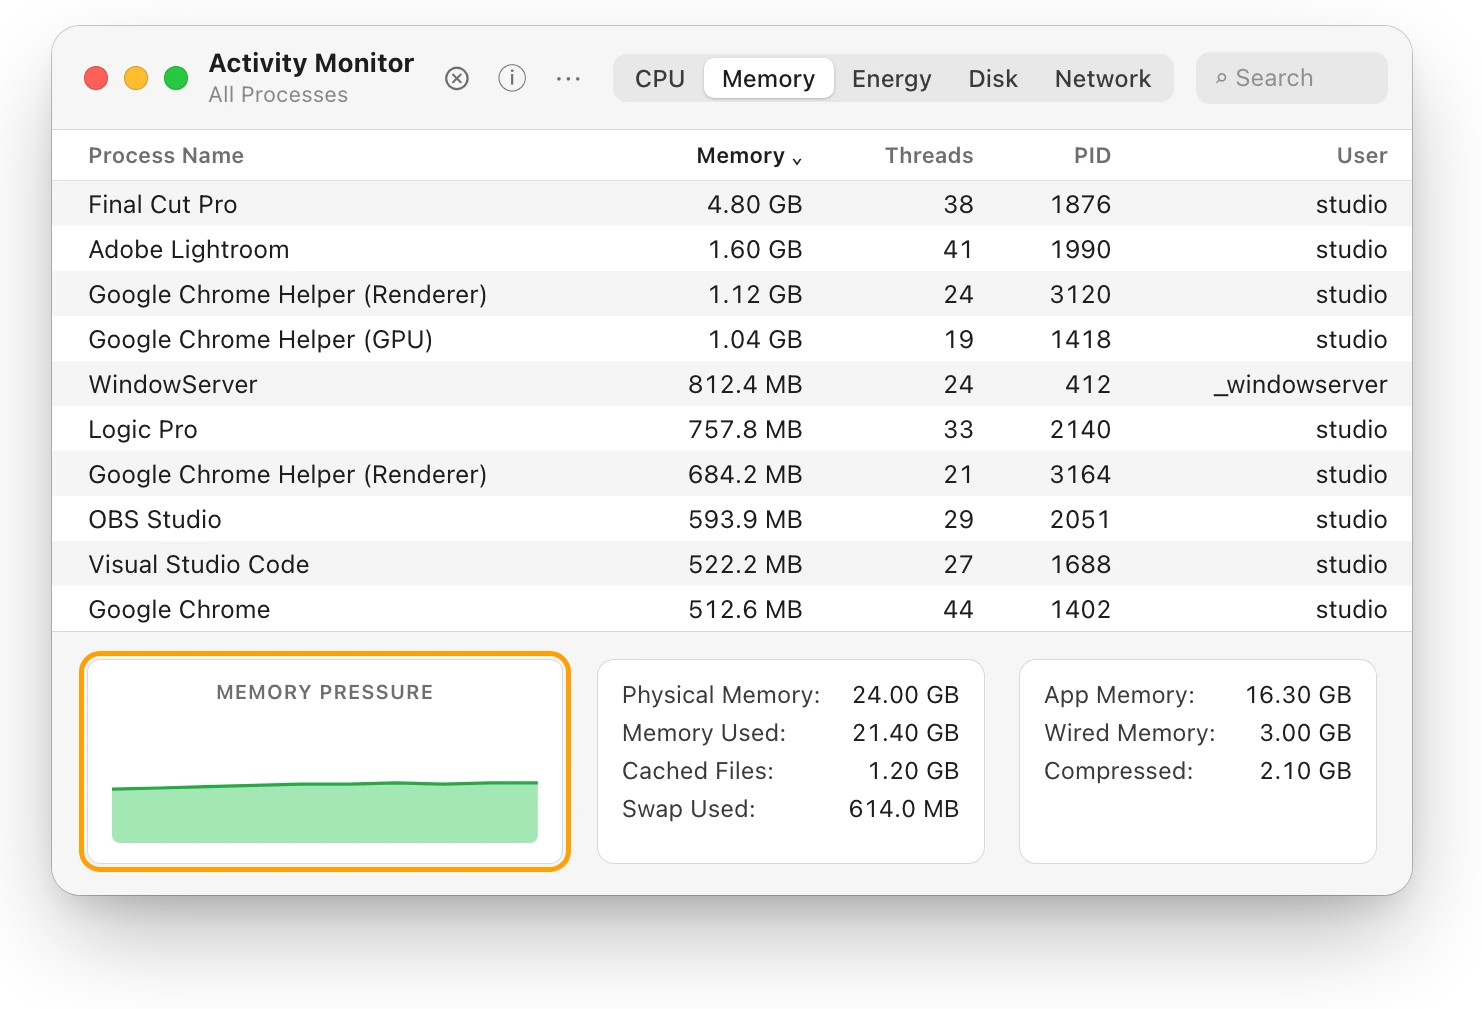
- Click Memory and look at the Memory Pressure graph at the bottom of the window. Apple says green means your Mac is using its memory efficiently, yellow means it might eventually need more, and red means it needs more.
- If it’s yellow or red, click the Memory column heading, save your work, and quit the apps at the top that you don’t need.
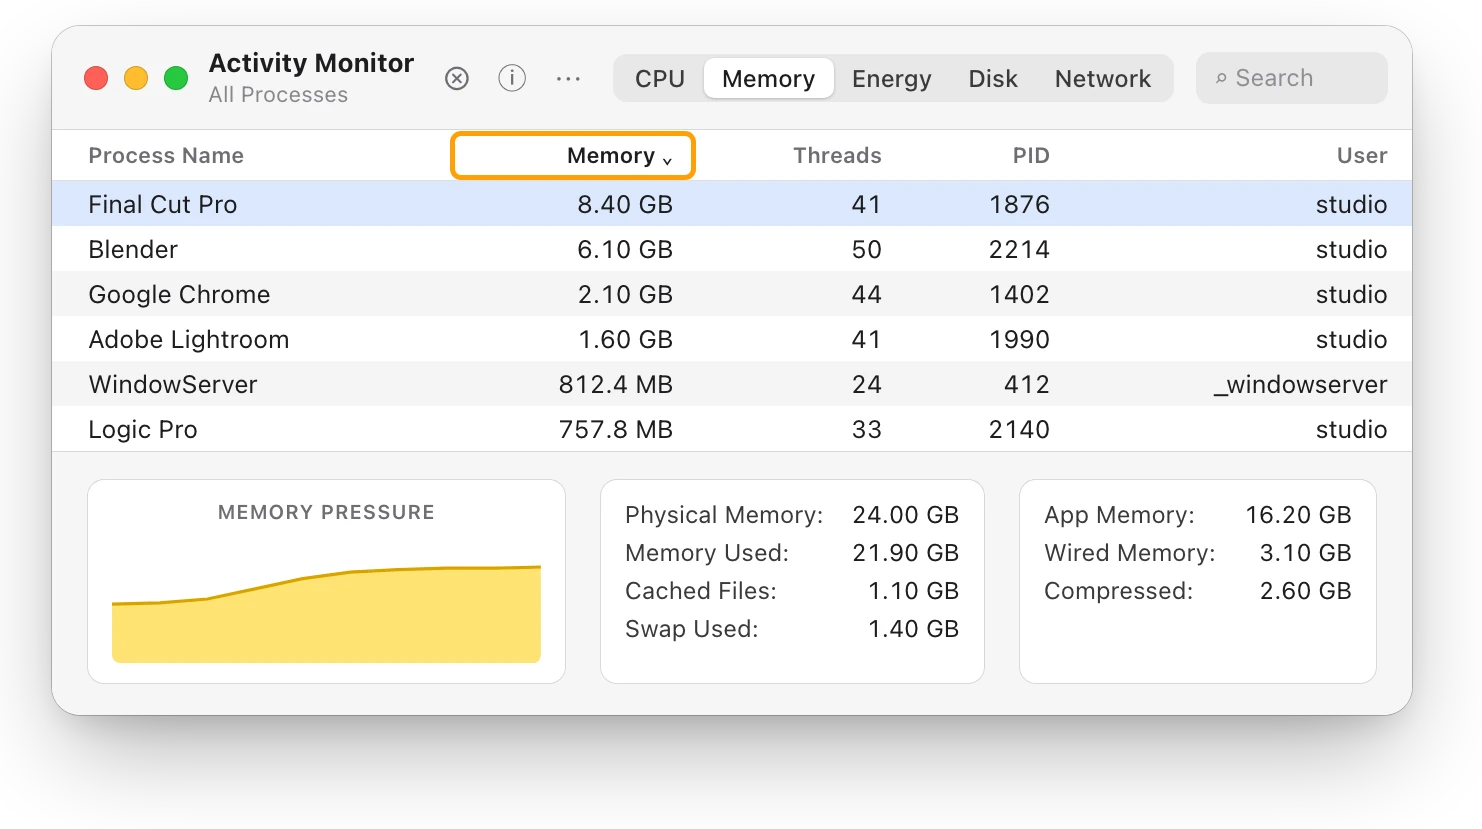
Activity Monitor’s Disk tab shows how often your Mac reads from and writes to its disk, and how much data, which helps when a large copy or backup is running. Which app is slowing down my Mac? and Mac memory pressure: why high RAM use is often fine go further into both lists.
Is my disk too full?
A startup disk without enough free space is one of the causes Apple lists for a Mac that runs slowly.
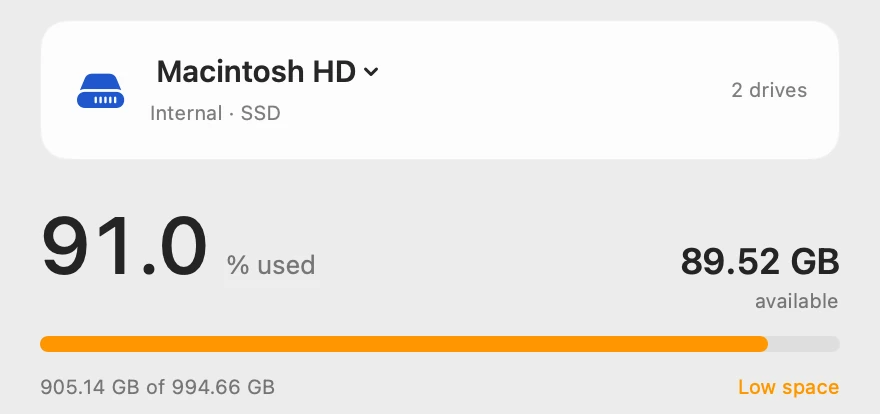
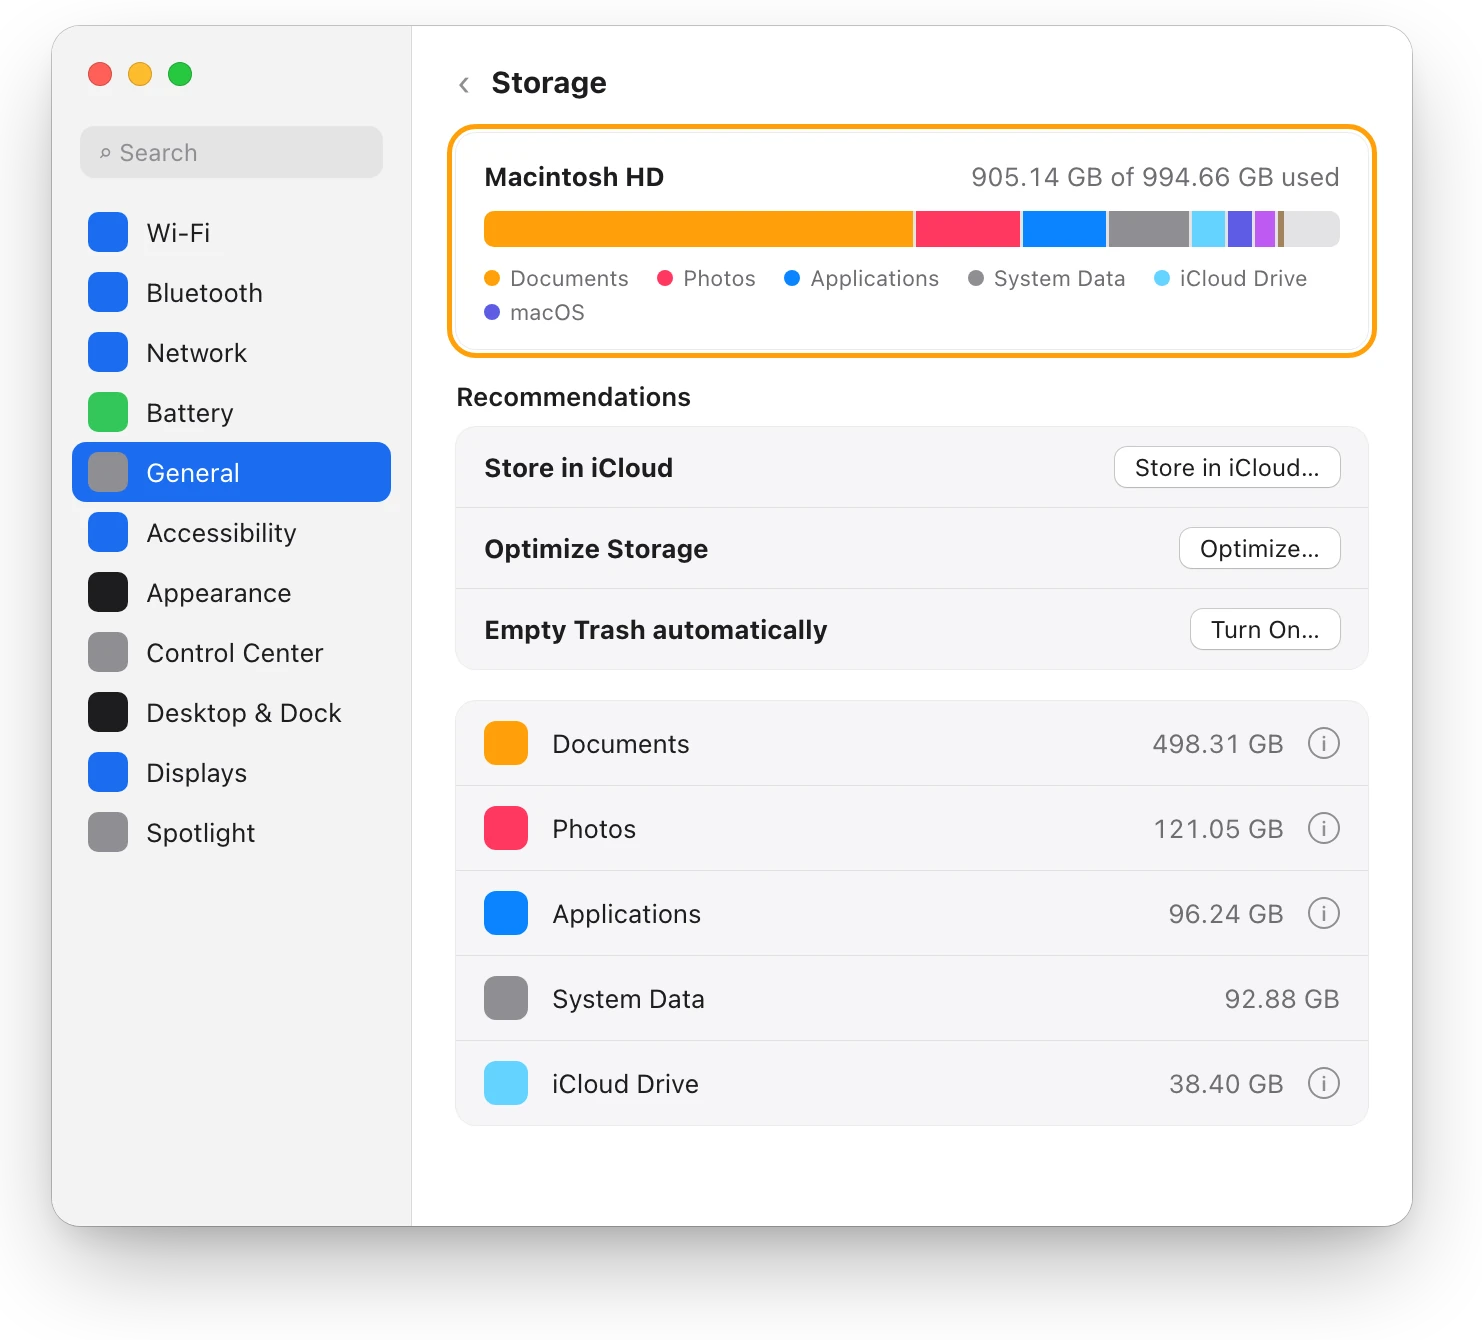
- Choose Apple menu > System Settings, click General in the sidebar, then click Storage.
- Read the line at the top: how much of the disk is used.
- If it’s nearly full, try the recommendations, move large files you want to keep to an external drive, delete files you don’t need, and empty the Trash.
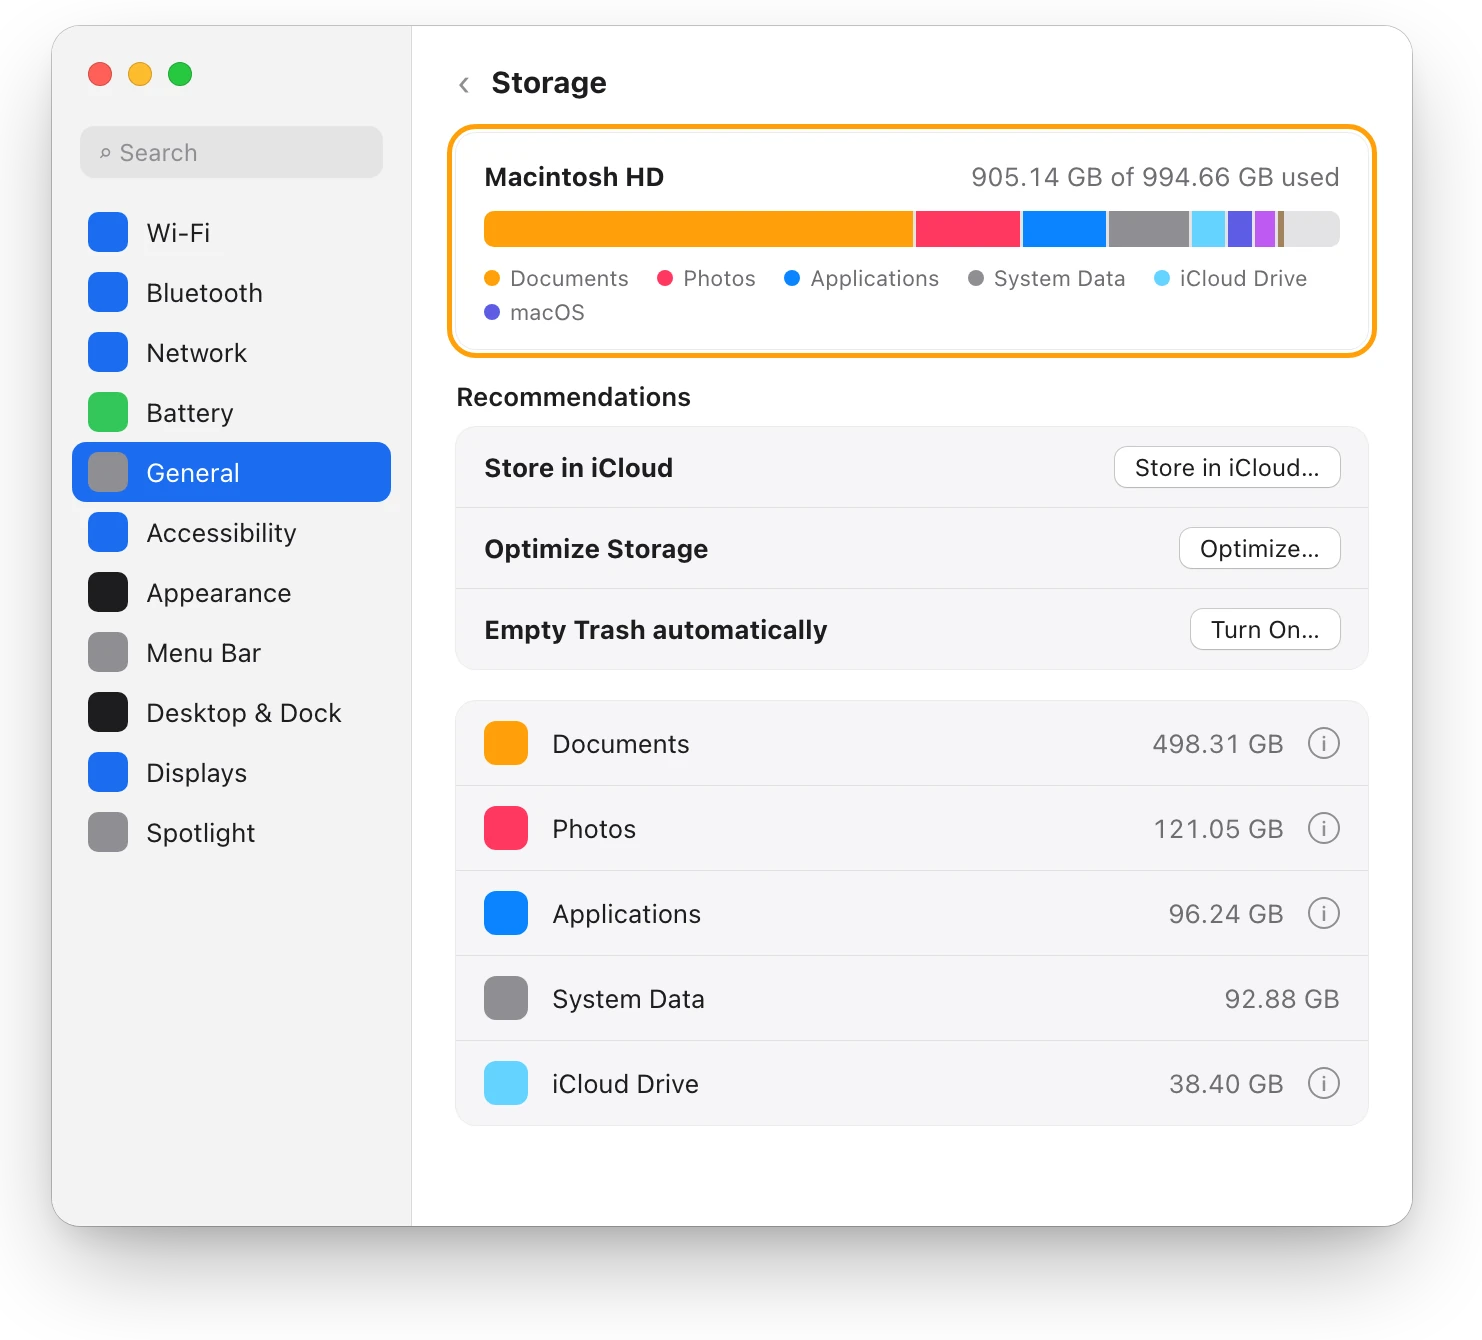
“Your disk is almost full”: what to do first walks through freeing space safely.
Why is there a spinning wheel right after an update?
After you install a macOS update or upgrade, Spotlight indexes your Mac again so search can find everything. Apple says this can take hours or even days, depending on how much data you have, and that it goes faster when your Mac isn’t in use and is connected to power and the internet. While it runs, the Spotlight window shows an indexing progress indicator at the top: press Command–Space bar to check.
Apple also lists Spotlight indexing after you move your data to a new Mac among the heavy tasks that make the fans speed up. Mac slow after a macOS update? What’s normal covers the rest.
What if Force Quit doesn’t work?
Restart your Mac: choose Apple menu > Restart. Restarting closes every app, including one that’s stuck, and starts fresh. If your Mac won’t restart, press and hold the power button for up to 10 seconds until it turns off, then press it again to turn it back on.
How do I test for software that loads at startup?
Safe mode starts your Mac without certain software: Apple names login items, extensions that macOS doesn’t need, and fonts that macOS didn’t install. It also checks the startup disk and clears some system caches.
On a Mac with Apple silicon:
- Shut down your Mac.
- Press and hold the power button. When you see “Loading startup options” or the Options icon, release it.
- Select your startup disk.
- Press and hold Shift, then click Continue in Safe Mode.
On a Mac with an Intel processor, turn it on and immediately press and hold Shift until you see the login window.
If the wheel stays away in safe mode but comes back after a normal restart, Apple says a login item or other software that safe mode blocks is the likely cause. Check System Settings > General > Login Items & Extensions. To leave safe mode, choose Apple menu > Restart.
Could it be a hardware problem?
If the wheel keeps coming back with no app busy, memory pressure green and space free, check the disk, then the hardware.
- Disk Utility. Apple suggests it for checking the disk and trying to repair it. Open Disk Utility, choose View > Show All Devices, select a volume, click First Aid, then click Run.
- Apple Diagnostics. On a Mac with Apple silicon, press and hold the power button until you see Options, release it, then press and hold Command-D. On an Intel-based Mac, turn it on and immediately press and hold D. When it’s done, it shows the results, with reference codes for any issue it finds.
Questions people also ask
Why does the spinning wheel appear and then go away?
Because the app caught up. The wait cursor appears when a delay of more than a few seconds occurs, and it goes once the app can respond again. A short spin while an app opens or saves a large file usually isn’t a problem.
Will force quitting lose my work?
It can. Force Quit closes the app at once, so changes you haven’t saved in it may be lost. Try Command-Q first, and force quit only when the app stops responding.
Does more RAM stop the spinning wheel?
Only when memory is the cause: when memory pressure stays yellow or red with just the apps you need. Is 8 GB or 16 GB of RAM enough for your Mac? helps you decide.
Scope for Mac · Free, coming to the Mac App Store
How Scope helps
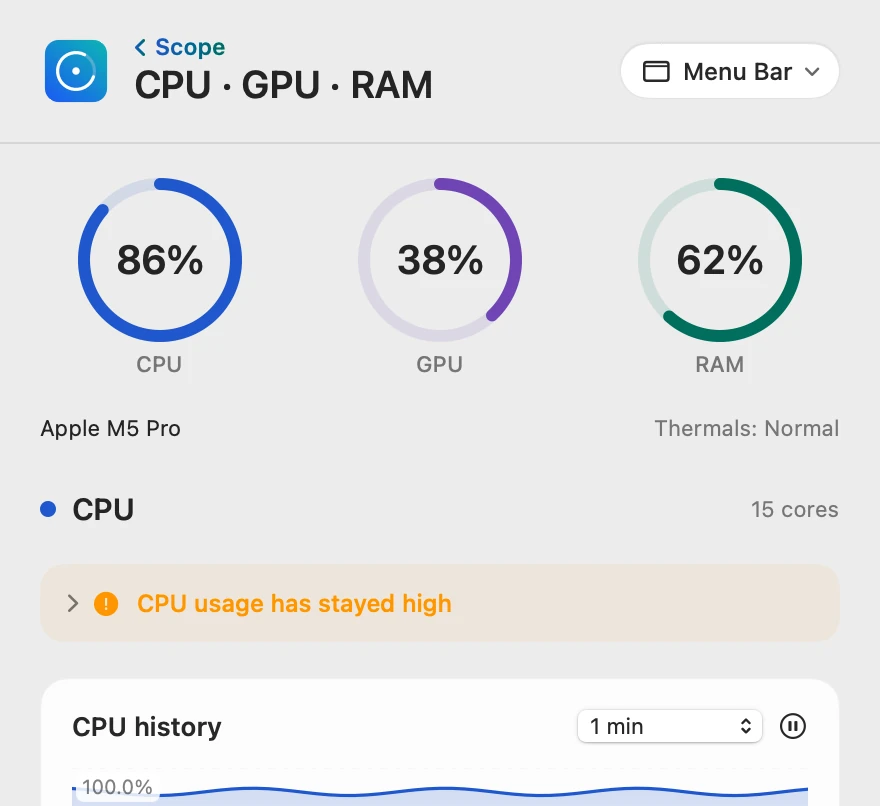
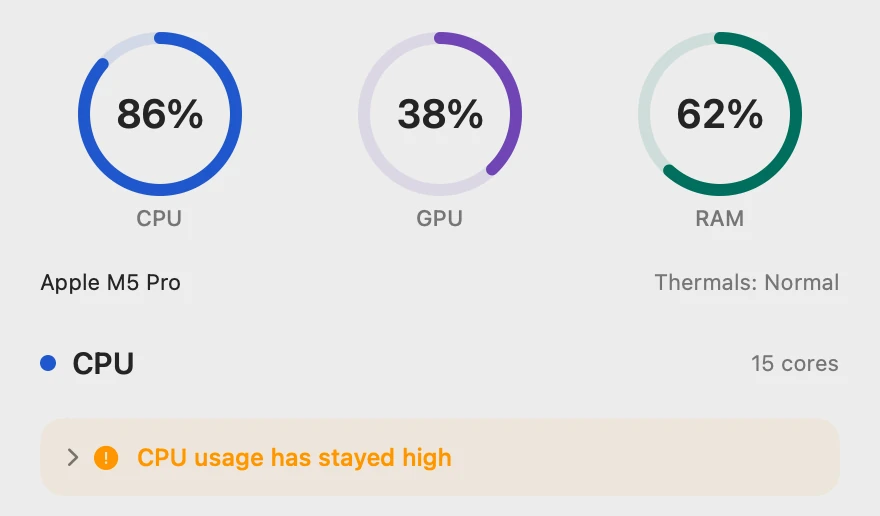
Scope is a free Mac menu bar app that shows what’s keeping your Mac busy when the spinning wheel appears: total CPU and the busiest apps, memory pressure in plain words, and how full your disk is. It tells you which of the three it is without opening Activity Monitor and System Settings.
In your menu bar
Scope Free keeps one whole menu bar item of your choice, so a busy processor is in view while you work.

The busy app
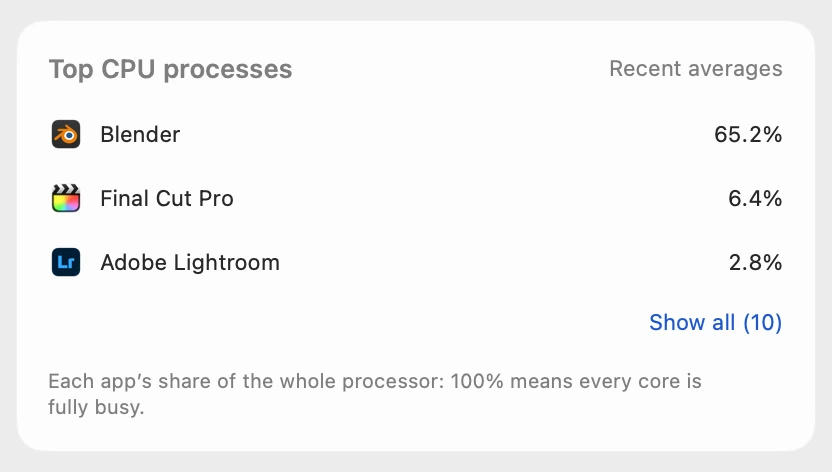
Scope shows each app’s share of the whole processor, so 100% means every core is busy: Blender’s 978.6% in Activity Monitor is 978.6 ÷ 15 = 65.2% here. The list shows the apps you run, not macOS’s background processes.
Memory running short
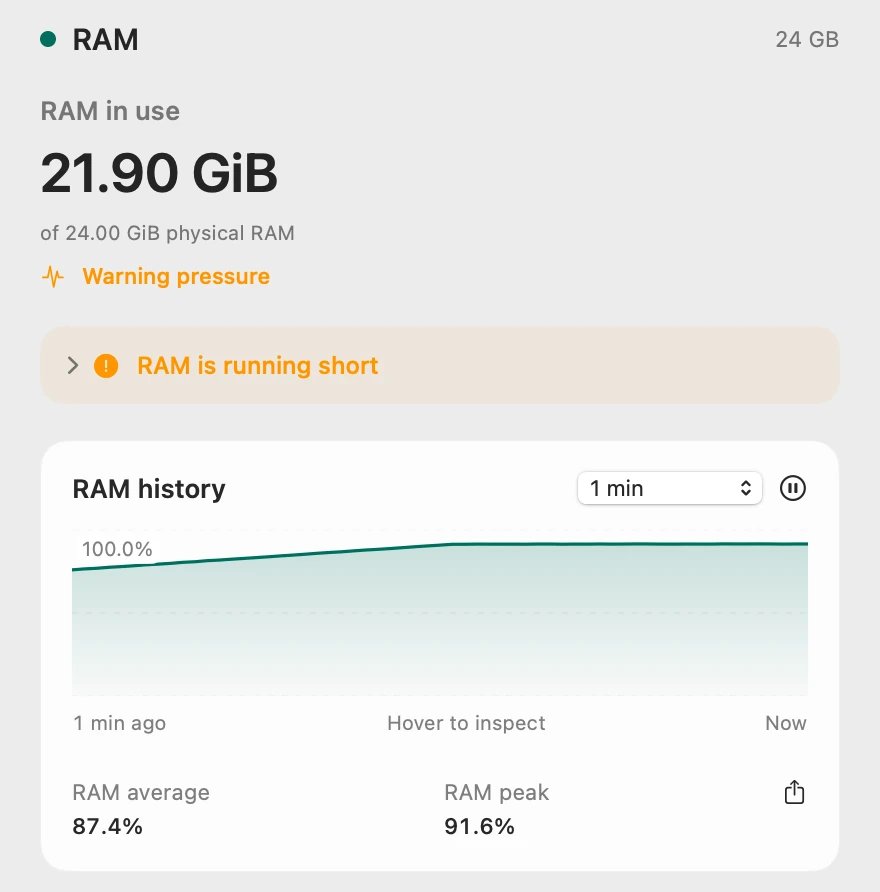
Scope’s RAM pressure is macOS’s memory pressure in words: Normal, Warning or Critical, which Activity Monitor shows as green, yellow and red. Scope writes GiB where Activity Monitor writes GB; for memory they’re the same measure.
How full the disk is
Drive marks Low space once a drive passes its limit, 90% unless you change it with Scope Pro. When memory runs short or a drive stays past its limit, Scope shows an alert on its overview, in Scope Free too. Scope Pro adds a red + on the menu bar icon and names the app or file behind it.
Scope shows and explains. It never quits apps, deletes files or changes settings, so what to close stays your call.
Try it here
The real Scope, working, right in this page.
Click any item in the menu bar, or a card inside, as you would on your Mac.
Scope Pro Every menu bar item is shown here. Scope Free keeps one whole item of your choice, with every reading inside.
See what’s keeping your own Mac busy.
Keep reading
Guide · Slow Mac
Why is my Mac slow? How to find the cause
A slow Mac is usually a busy app, too little memory, a nearly full disk or heat. Here’s how to see which one with macOS’s own tools.
Your Mac
Task Manager on a Mac: how to open it
The Mac’s Task Manager is Activity Monitor. Open it with Spotlight, quit a frozen app with Option-Command-Esc, and see what replaces each Windows tool.
Slow Mac
Which app is slowing down my Mac? How to find it
Activity Monitor shows which app is slowing your Mac: sort by % CPU, then by Memory. Here’s how to read the lists, and what to do next.
Slow Mac
Mac memory pressure: why high RAM use is often fine
Memory pressure, not RAM in use, shows if your Mac has enough memory. Green is fine even when RAM is nearly full; yellow or red means it’s running short.
Storage
“Your disk is almost full”: what to do first
When your Mac’s disk is almost full, check Storage in System Settings, empty the Trash, then delete or move large files. Here’s what to do first.
Slow Mac
Mac slow after a macOS update? What’s normal
After a macOS update, Spotlight indexes your Mac again, which Apple says can take hours or days. Keep it on power; if it stays slow, check apps and space.
Sources
- Apple Support: Pointers in macOS
- Apple Support: How to force an app to quit on Mac
- Apple Support: Quit a process in Activity Monitor on Mac
- Apple Support: View and open apps on Mac
- Apple Support: View information about Mac processes in Activity Monitor
- Apple Support: Check if your Mac needs more RAM in Activity Monitor
- Apple Support: View disk activity in Activity Monitor on Mac
- Apple Support: If your Mac runs slowly
- Apple Support: Free up storage space on Mac
- Apple Support: About Spotlight indexing and search results on Apple devices
- Apple Support: About fans and fan noise in your Apple product
- Apple Support: Start up your Mac in safe mode
- Apple Support: Open items automatically when you log in on Mac
- Apple Support: Repair a storage device in Disk Utility on Mac
- Apple Support: Use Apple Diagnostics to test your Mac
Last checked October 19, 2026. Readings, apps and files in the pictures are from a made-up Mac.